I work with a lot of customers to design and deploy secure, zero-trust environments utilising VMware NSX-T Data Center and, specifically, by using its Distributed Firewall (DFW). I’ve also spoken at several VMUGs where I’ve discussed the realities of micro-segmentation using both NSX for vSphere (NSX-v) and NSX-T and the tools that can be utilised to aid in the identification of application dependencies, traffic flows, services, etc.
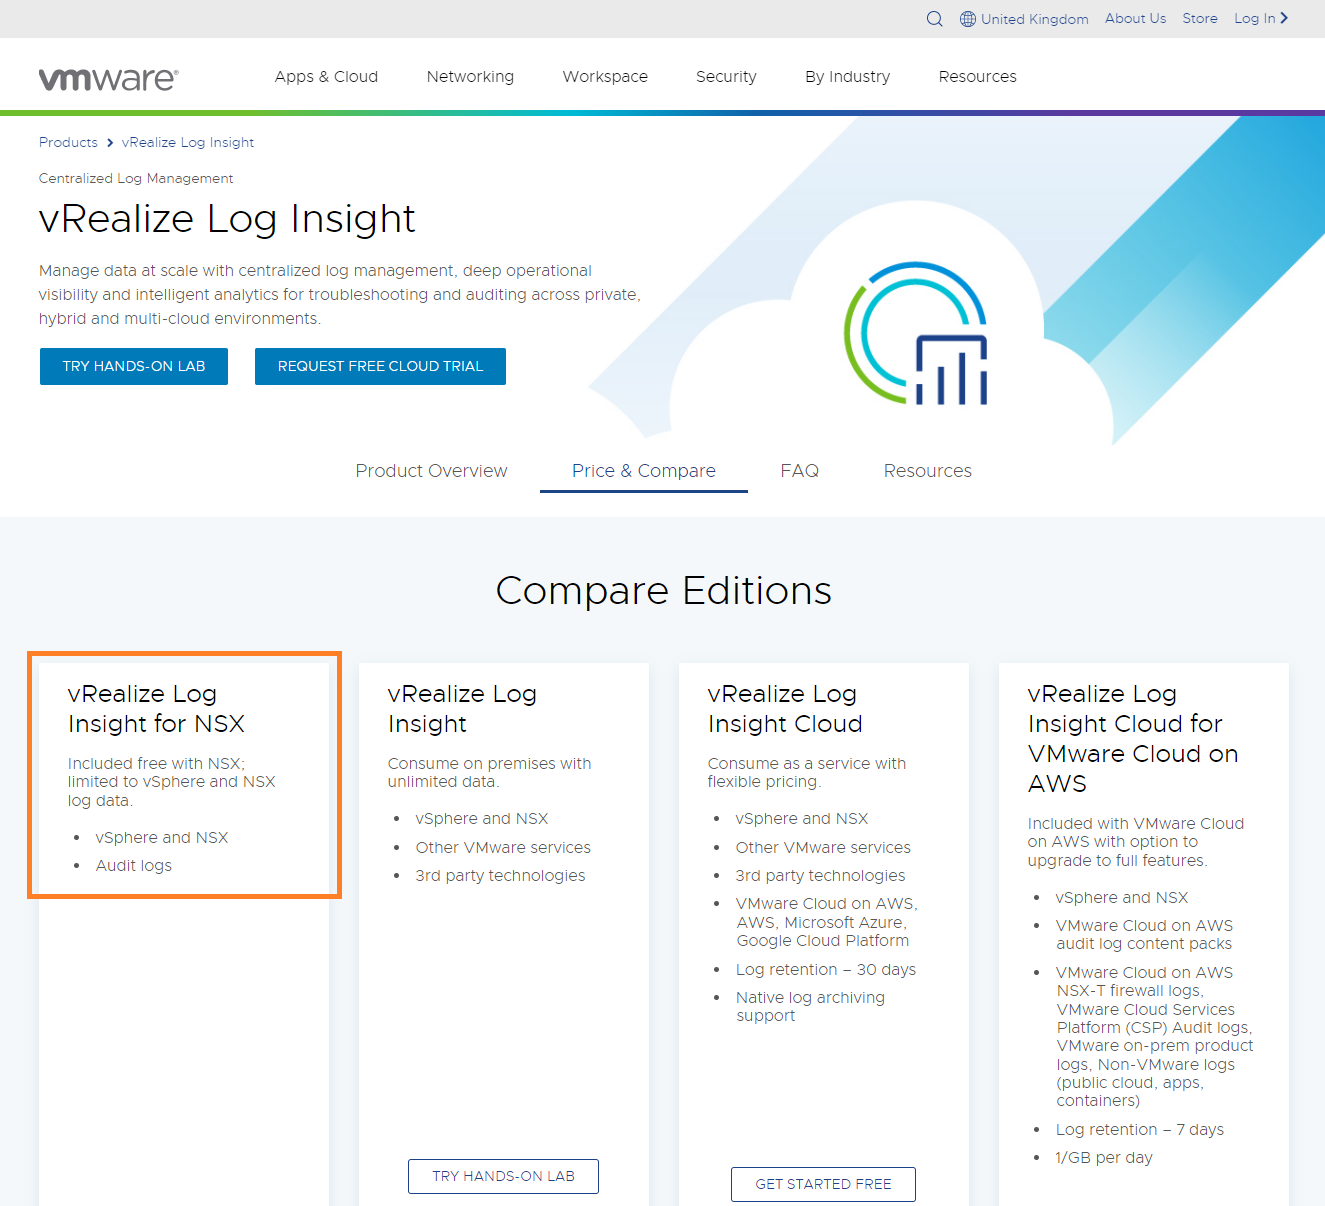
I also understand that not all customers are able to utilise some of the more advanced VMware toolings such as NSX Intelligence and vRealize Network Insight, however, there is another tool that we can use to identify our application dependencies and, best of all, if you’re a licensed NSX-T customer, you’re also licensed for…vRealize Log Insight (vRLI).
In this article, we explore how we can utilise vRLI to identify and visualise application traffic flows so that we can more effectively secure our applications.
As mentioned previously, vRLI is available to any customer licensed for NSX-T. Simply view the vRealize Log Insight homepage for more information around licensing.
Prerequisites – Remote Logging
At time of writing (NSX-T 3.1.3.3), we can easily configure Syslog servers for all NSX-T transport nodes via UI or CLI whereas, previously, this task could only be implemented via CLI. By browsing to System > Fabric > Profiles > Node Profiles, we can quickly add our vRLI instance as a Syslog server.

To confirm the Syslog configuration, SSH to your NSX Managers and Edges and run the command get logging-servers. The recently added Syslog server should be output.
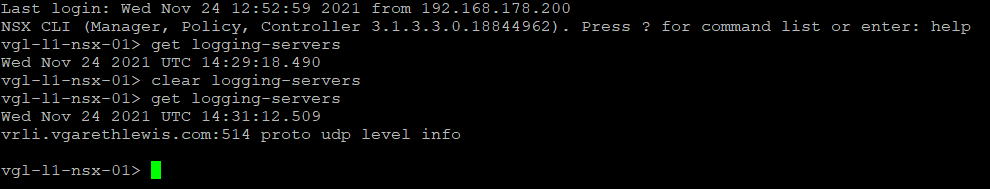

Alternatively, to add a Syslog server manually via CLI, simply SSH onto your NSX Managers and Edges and run the command set logging-server <IP Address or FQDN> proto udp level info. Again, you can then run get logging-servers to confirm successful application. In the event that you may have entered an incorrect IP address/FQDN, simply run clear logging-servers and re-run the set logging-server command again.
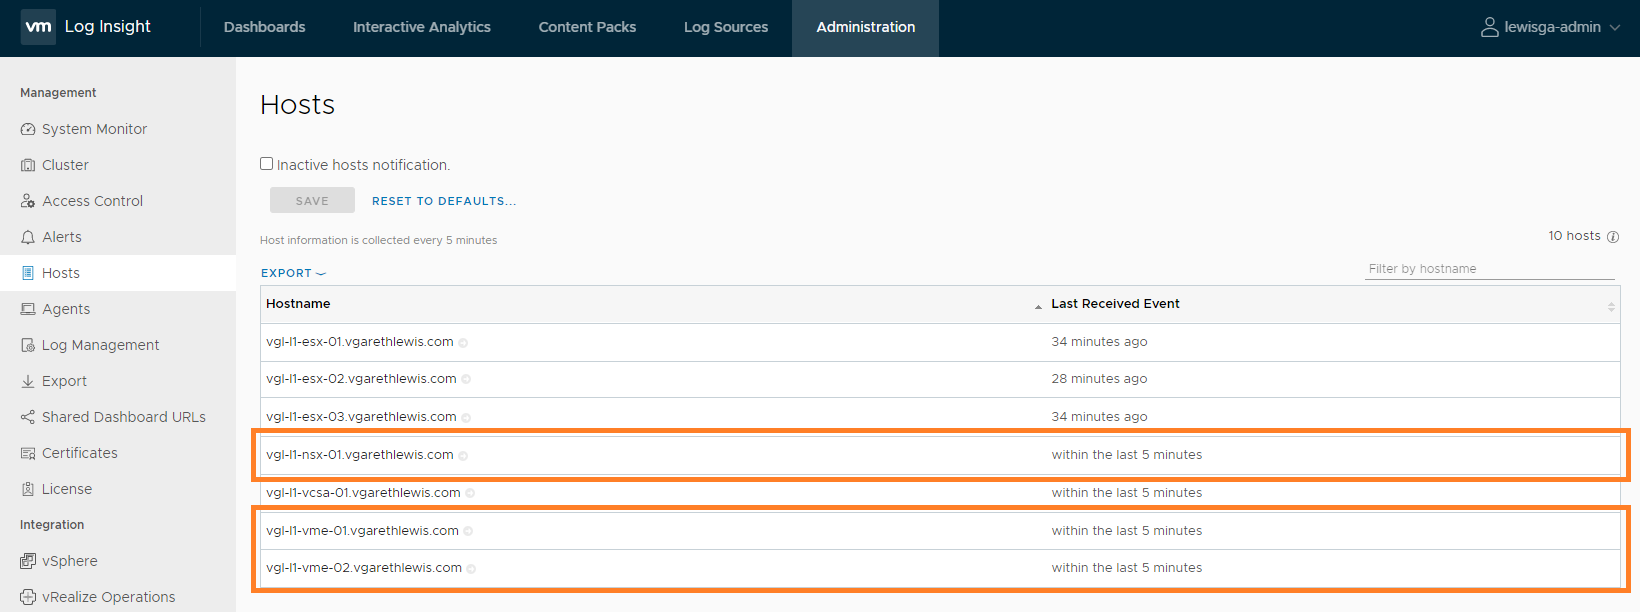
Once added, let’s confirm that the NSX-T nodes are visible within vRLI by browsing to Administration > Management > Hosts.
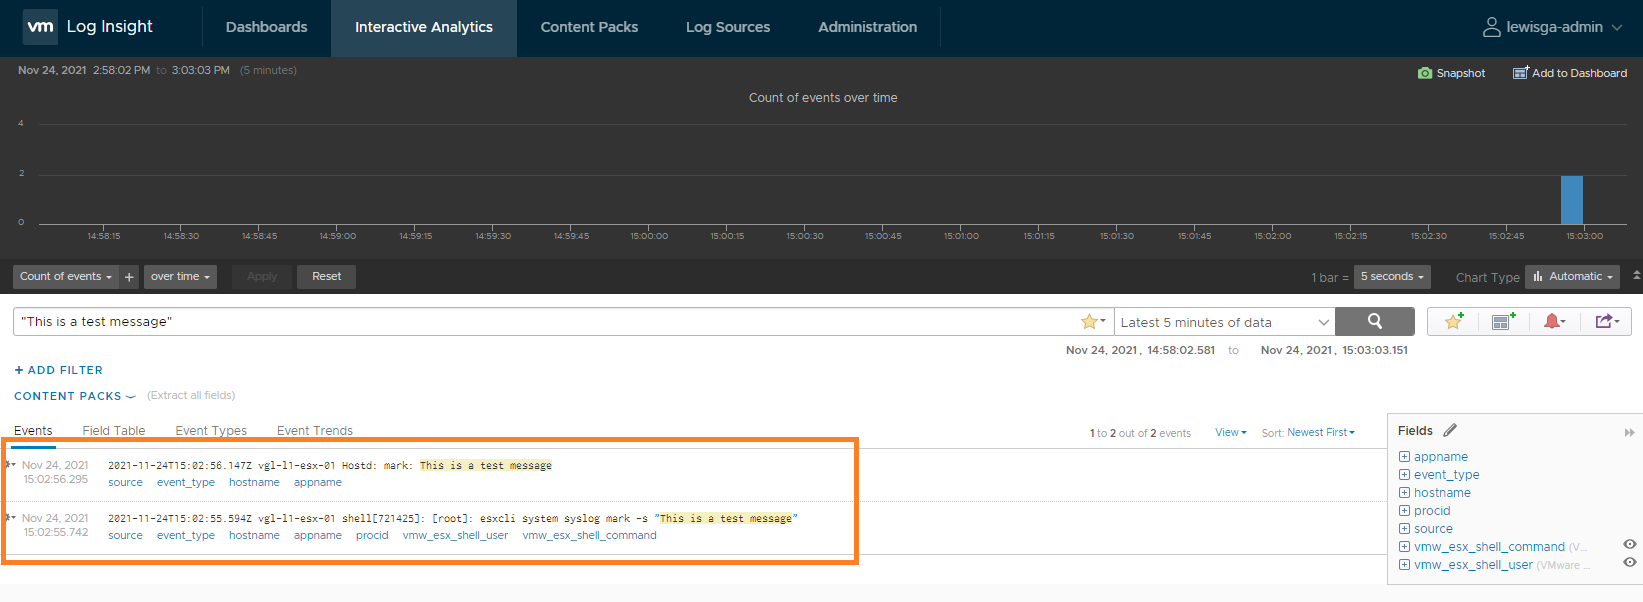
Finally, we need to configure our ESXi hosts to forward firewall log information. Using the below commands, line 1 configures firewall logging and, on line 2, sends a test message from the ESXi host to vRLI so that I can validate all is well.
esxcli network firewall ruleset set -r syslog -e true

esxcli system syslog mark -s "This is a test message"
If I log on to my vRLI server, browse to Interactive Analytics and search for “This is a test message”, we can see the successful output.
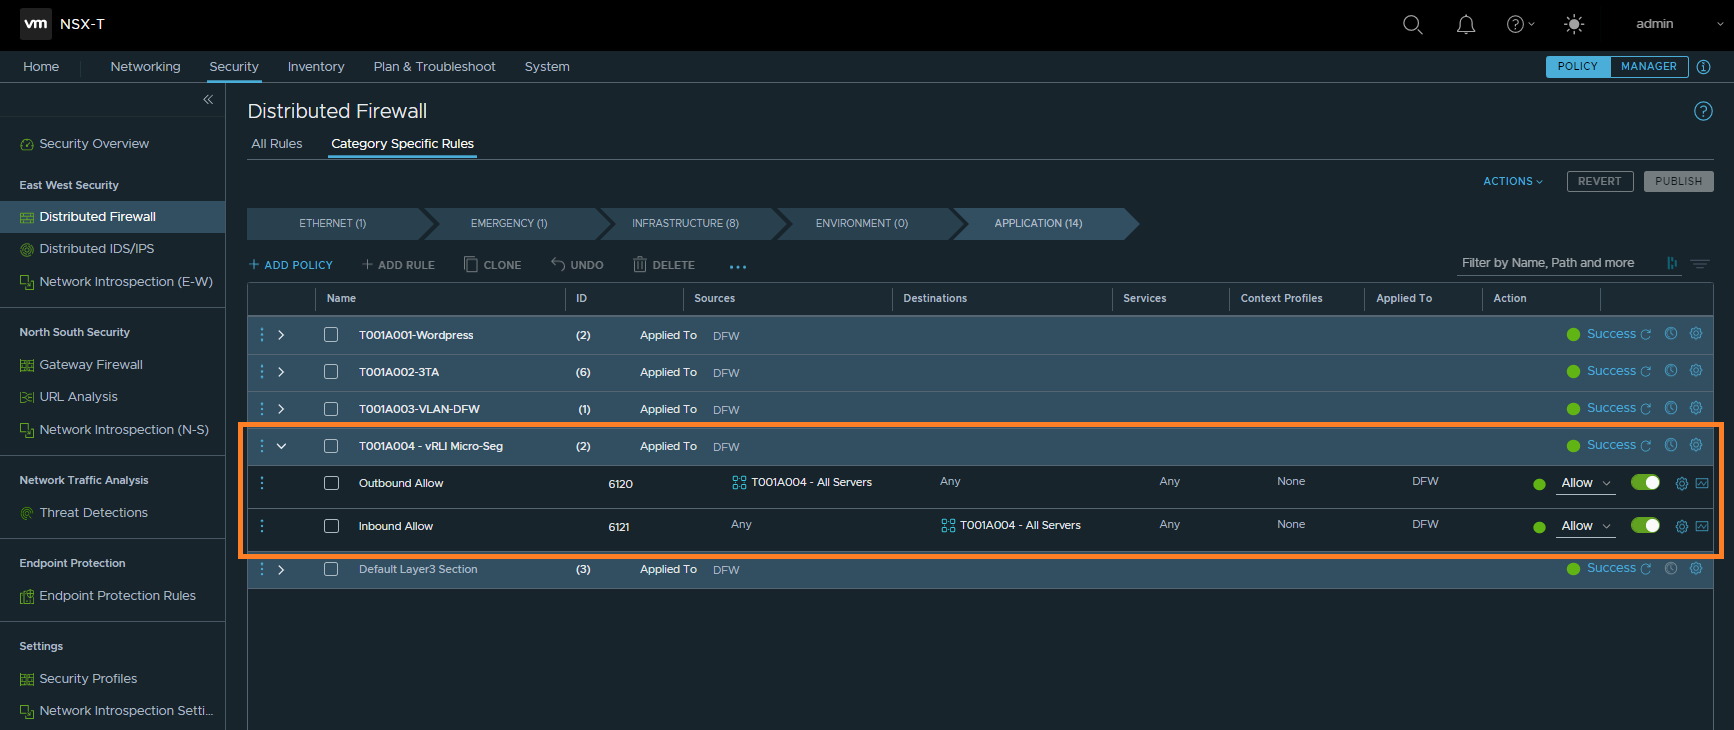
Micro-Segmentation via the NSX-T DFW
Now that we have enabled Syslogging on our NSX-T nodes, as well as having validated that our ESXi hosts are able to send firewall log information to vRLI, let’s take a look at an application which we need to secure within the NSX-T DFW.
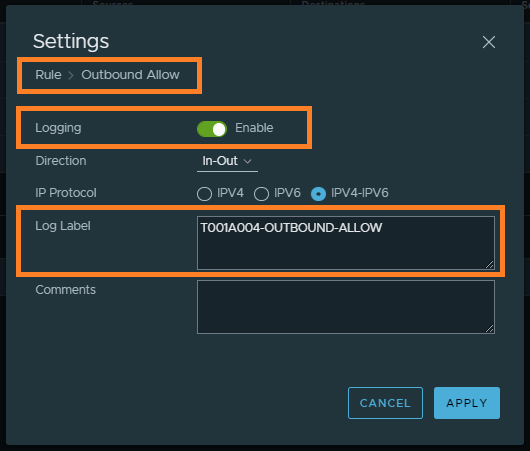
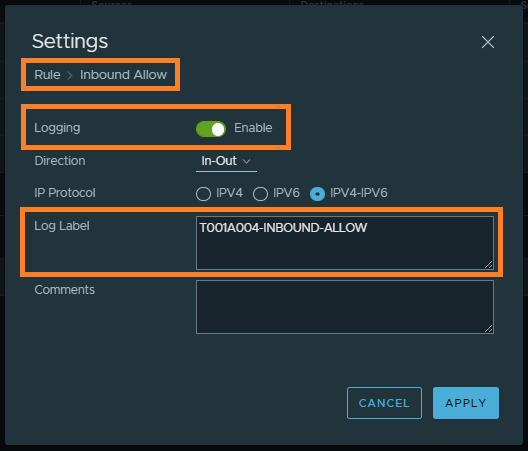
I have a VM, T001A004-WEB-01, housed on an NSX-T Segment. To enable logging for this application we create inbound and outbound DFW rules with logging enabled. In the below screenshots, you can see the creation of the required rules and, via the rule’s settings, we enable logging and append a suitable tag/log label which we can later use to interrogate traffic within vRLI.
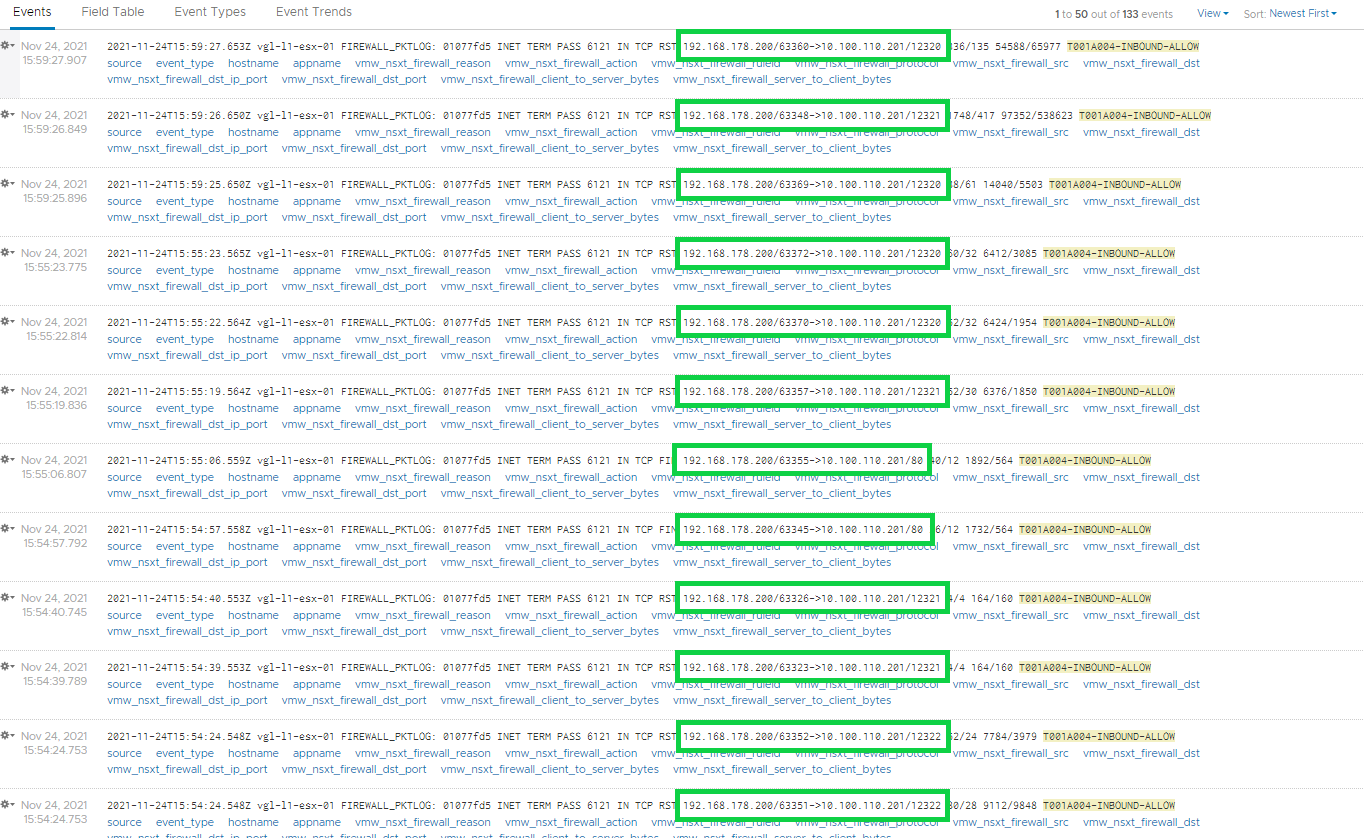
We can now jump back to vRLI and begin to review the inbound and outbound traffic flows. Here I’ve created a custom dashboard that displays an overview of each of these flow types. This would, ideally, be left for an appropriate amount of time so that we can create a more realistic picture of inbound/outbound traffic flows.
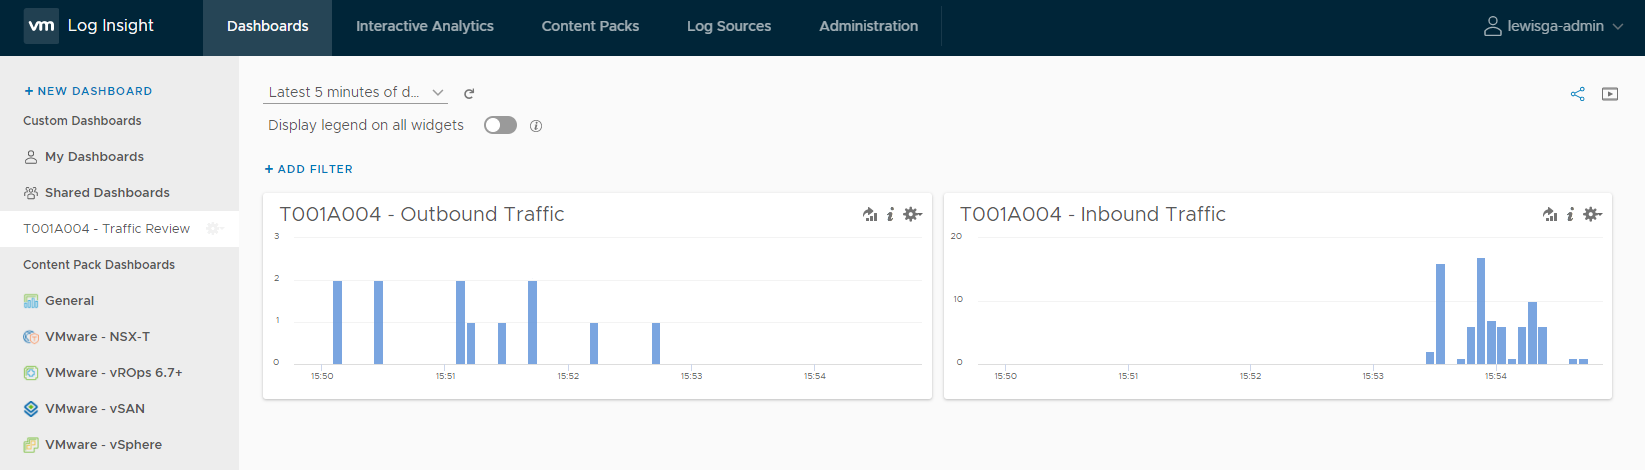
By reviewing the collected traffic flows we can already see some good information. In the below screenshot (inbound traffic), note the inbound traffic on ports TCP 80/HTTP, TCP 12320 and TCP 12321 – the former being the port utilised for general web application traffic, and the latter two for appliance management. I accept these as trusted traffic flows and will use them later to build out my DFW rules.
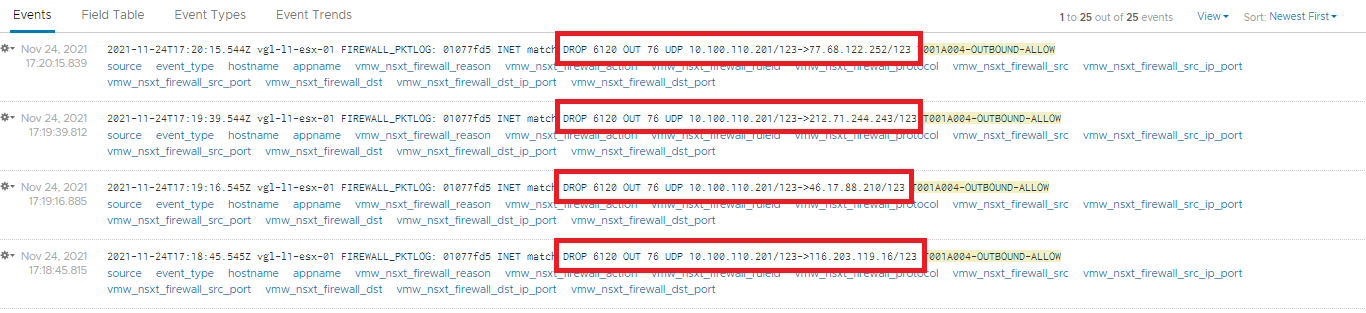
Furthermore, in the below screenshot (outbound traffic), I note that there appears to be a lot of outbound traffic from the virtual machine to external NTP servers. This traffic will NOT be accepted as trusted flows and will not be added to the DFW. As a result, the traffic will be dropped by the DFW’s default drop rule, and we will validate such in a later step.

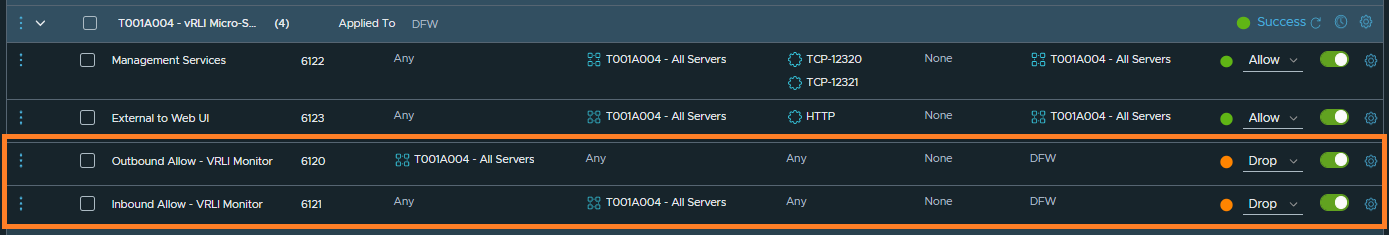
From the data flows identified above, I will implement the below firewall rules. All other traffic will be dropped.
- Any > T001A004-WEB-01 > via TCP 80 > Allow
- Any > T001A004-WEB-01 > via TCP 12320 > Allow
- Any > T001A004-WEB-01 > via TCP 12321 > Allow
NSX-T Distributed Firewall Rules
Using the above information, I now create two new rules (one to enable traffic to the VM’s web application via HTTP, and another to enable access to the appliance’s management interfaces on TCP 12320 and TCP 12321). From the below screenshot you’ll also note I’ve switched the initial monitor rules to drop and moved them below the application rules; this is so I can continue to monitor for any valid traffic that might have been missed or to validate dropped traffic. Furthermore, the virtual machine has been added to a dynamic Group in case I wish to scale out these web servers in the future.
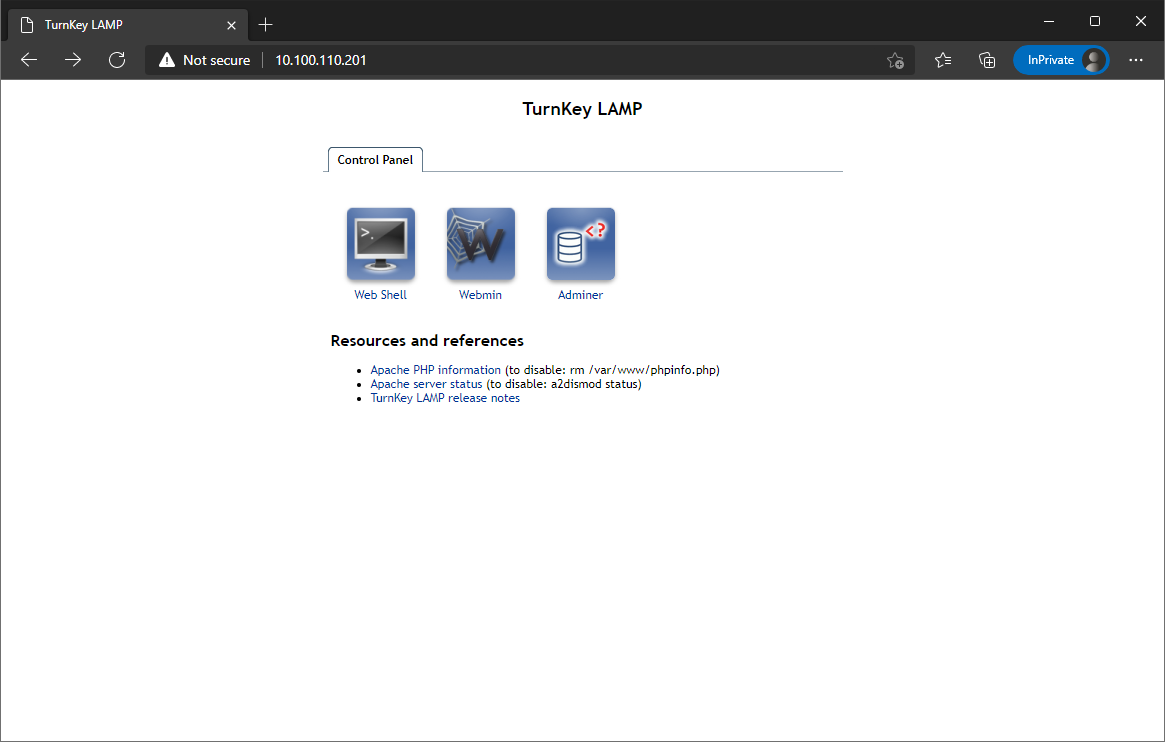
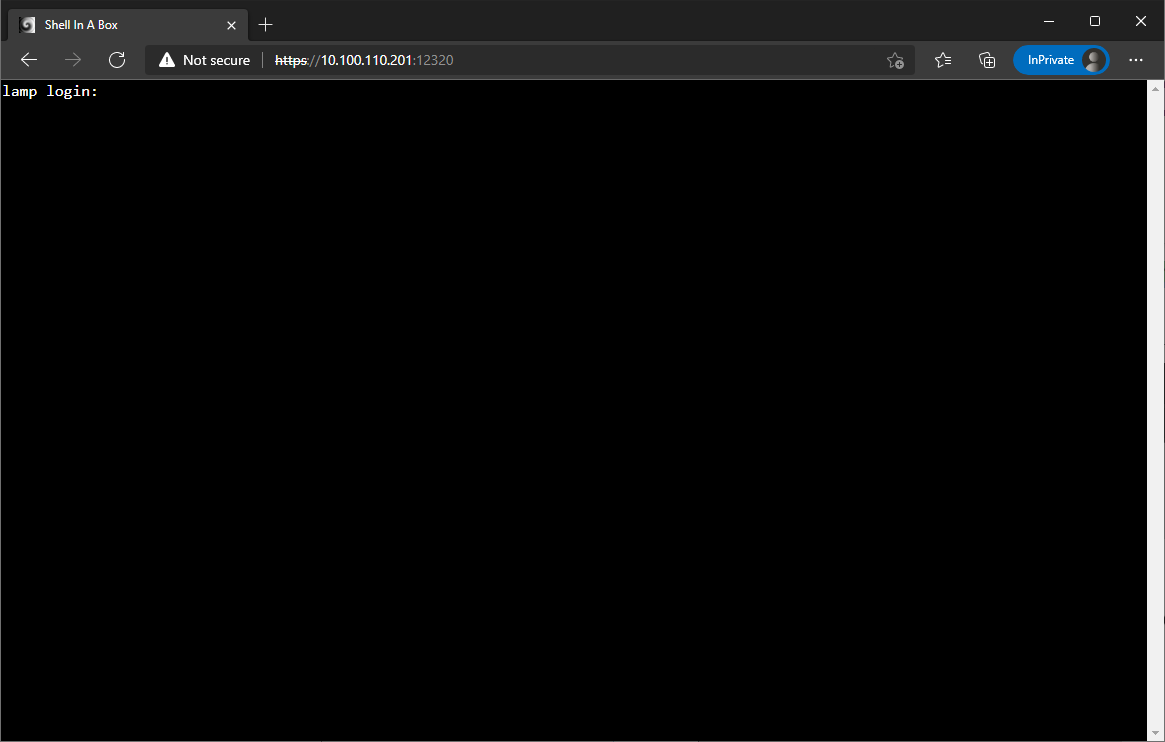
From the below screenshots, access to the virtual machine via TCP 80, TCP 12320 and TCP 12321 are successful.
We can also note that all other traffic is dropped as pre design.

Finally, checking vRLI once more, we can now see that the previously identified and untrusted NTP traffic is now successfully dropped.
In Summary
In this article, we looked at how we can utilise vRLI to visualise an application’s traffic flows via the NSX-T DFW, before using that information to secure an application. Furthermore, we then validated the DFW rules further by ensuring any/all untrusted traffic flows were dropped.
In production environments, it would be beneficial to allow the data collection process to span a suitable time window, so as to ensure the most realistic picture of the application’s traffic flows can be captured.
Where advanced tooling such as NSX Intelligence and vRealize Network Insight are not available to customers, vRealize Log Insight is a fantastic tool to enable more efficient micro-segmentation and remove any potential second-guessing. Most importantly, vRLI can enable customers to continue on their quest for true zero-trust environments.
Leave a Reply