With the release of VMware NSX 6.3.0 back in February 2017, we saw the introduction of the Application Rule Manager (ARM). The Application Rule Manager allows us to a) simplify the process of creating grouping objects and distributed firewall rules for the micro-segmentation of existing workloads, and b) deploy applications within a zero-trust environment with greater speed and efficiency.
Let’s Be Straight Up…
Micro-segmenting applications is not always a straight forward exercise, due mainly to a lack of application and security dependencies (aka – solid documentation). In the past, I’ve requested such information from a number of established vendors/software houses, only to be presented with vague information at best. Software development partners/teams don’t generally think about the infrastructure/networking stack (and why would they?), so security is not normally something on their list.
So, how exactly are us infrastructure and networking guys supposed to micro-segment these workloads with limited/no information? Hello, Application Rule Manager!
Simply put, the Application Rule Manager utilises flow monitoring to collect data across applications and systems. Once collected, we can analyse the output to create a true model of the application dependencies and firewalling requirements, and create the required NSX Distributed Firewall rules to enable traffic to flow unhindered between the solution endpoints.
Real World…
Each new application brought into service at my employer utilises VXLAN and Logical Switches, and are secured and micro-segmented via the NSX Distributed Firewall. We have worked hard to create a culture of zero-trust and, as such, I use the Application Rule Manager often, and the speed at which I am able to identify application dependencies, create grouping objects and apply these to NSX Distributed Firewall rules is impressive. We are no longer in the dark, held hostage by a lack of application documentation. The Application Rule Manager enables us to deploy and secure applications and systems at speed.
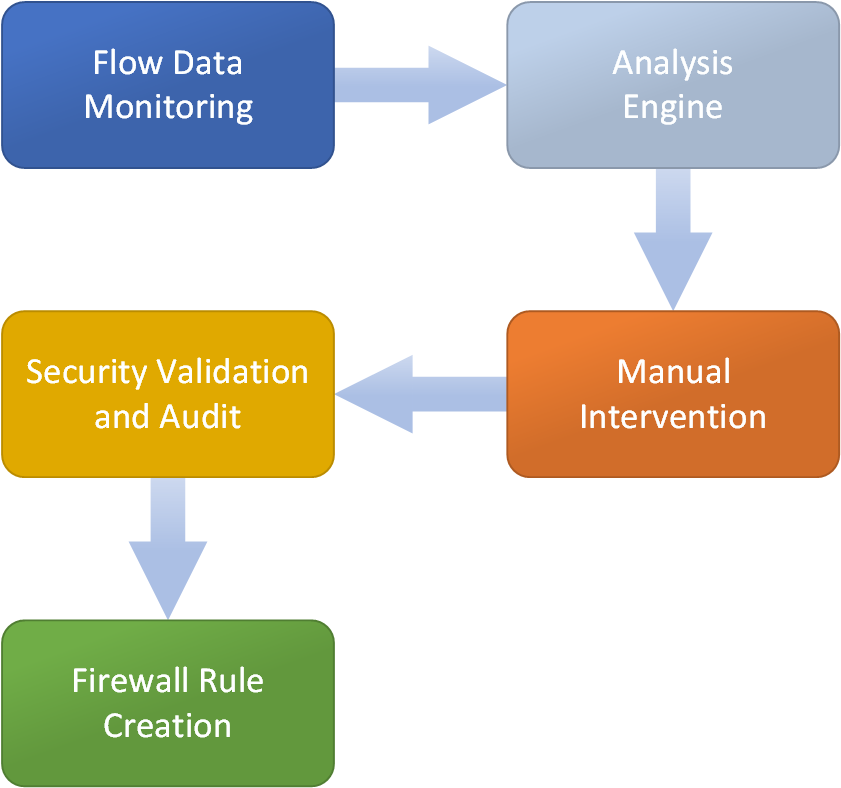
The workflow itself is simple:
- Create a monitoring session to monitor data flows between all application endpoints.
- Analyse data flows.
- Manual intervention and customisation of source/destination traffic and services.
- Validation and audit.
- Creation and publication of distributed firewall rules directly from the Application Rule Manager.
The Scenario
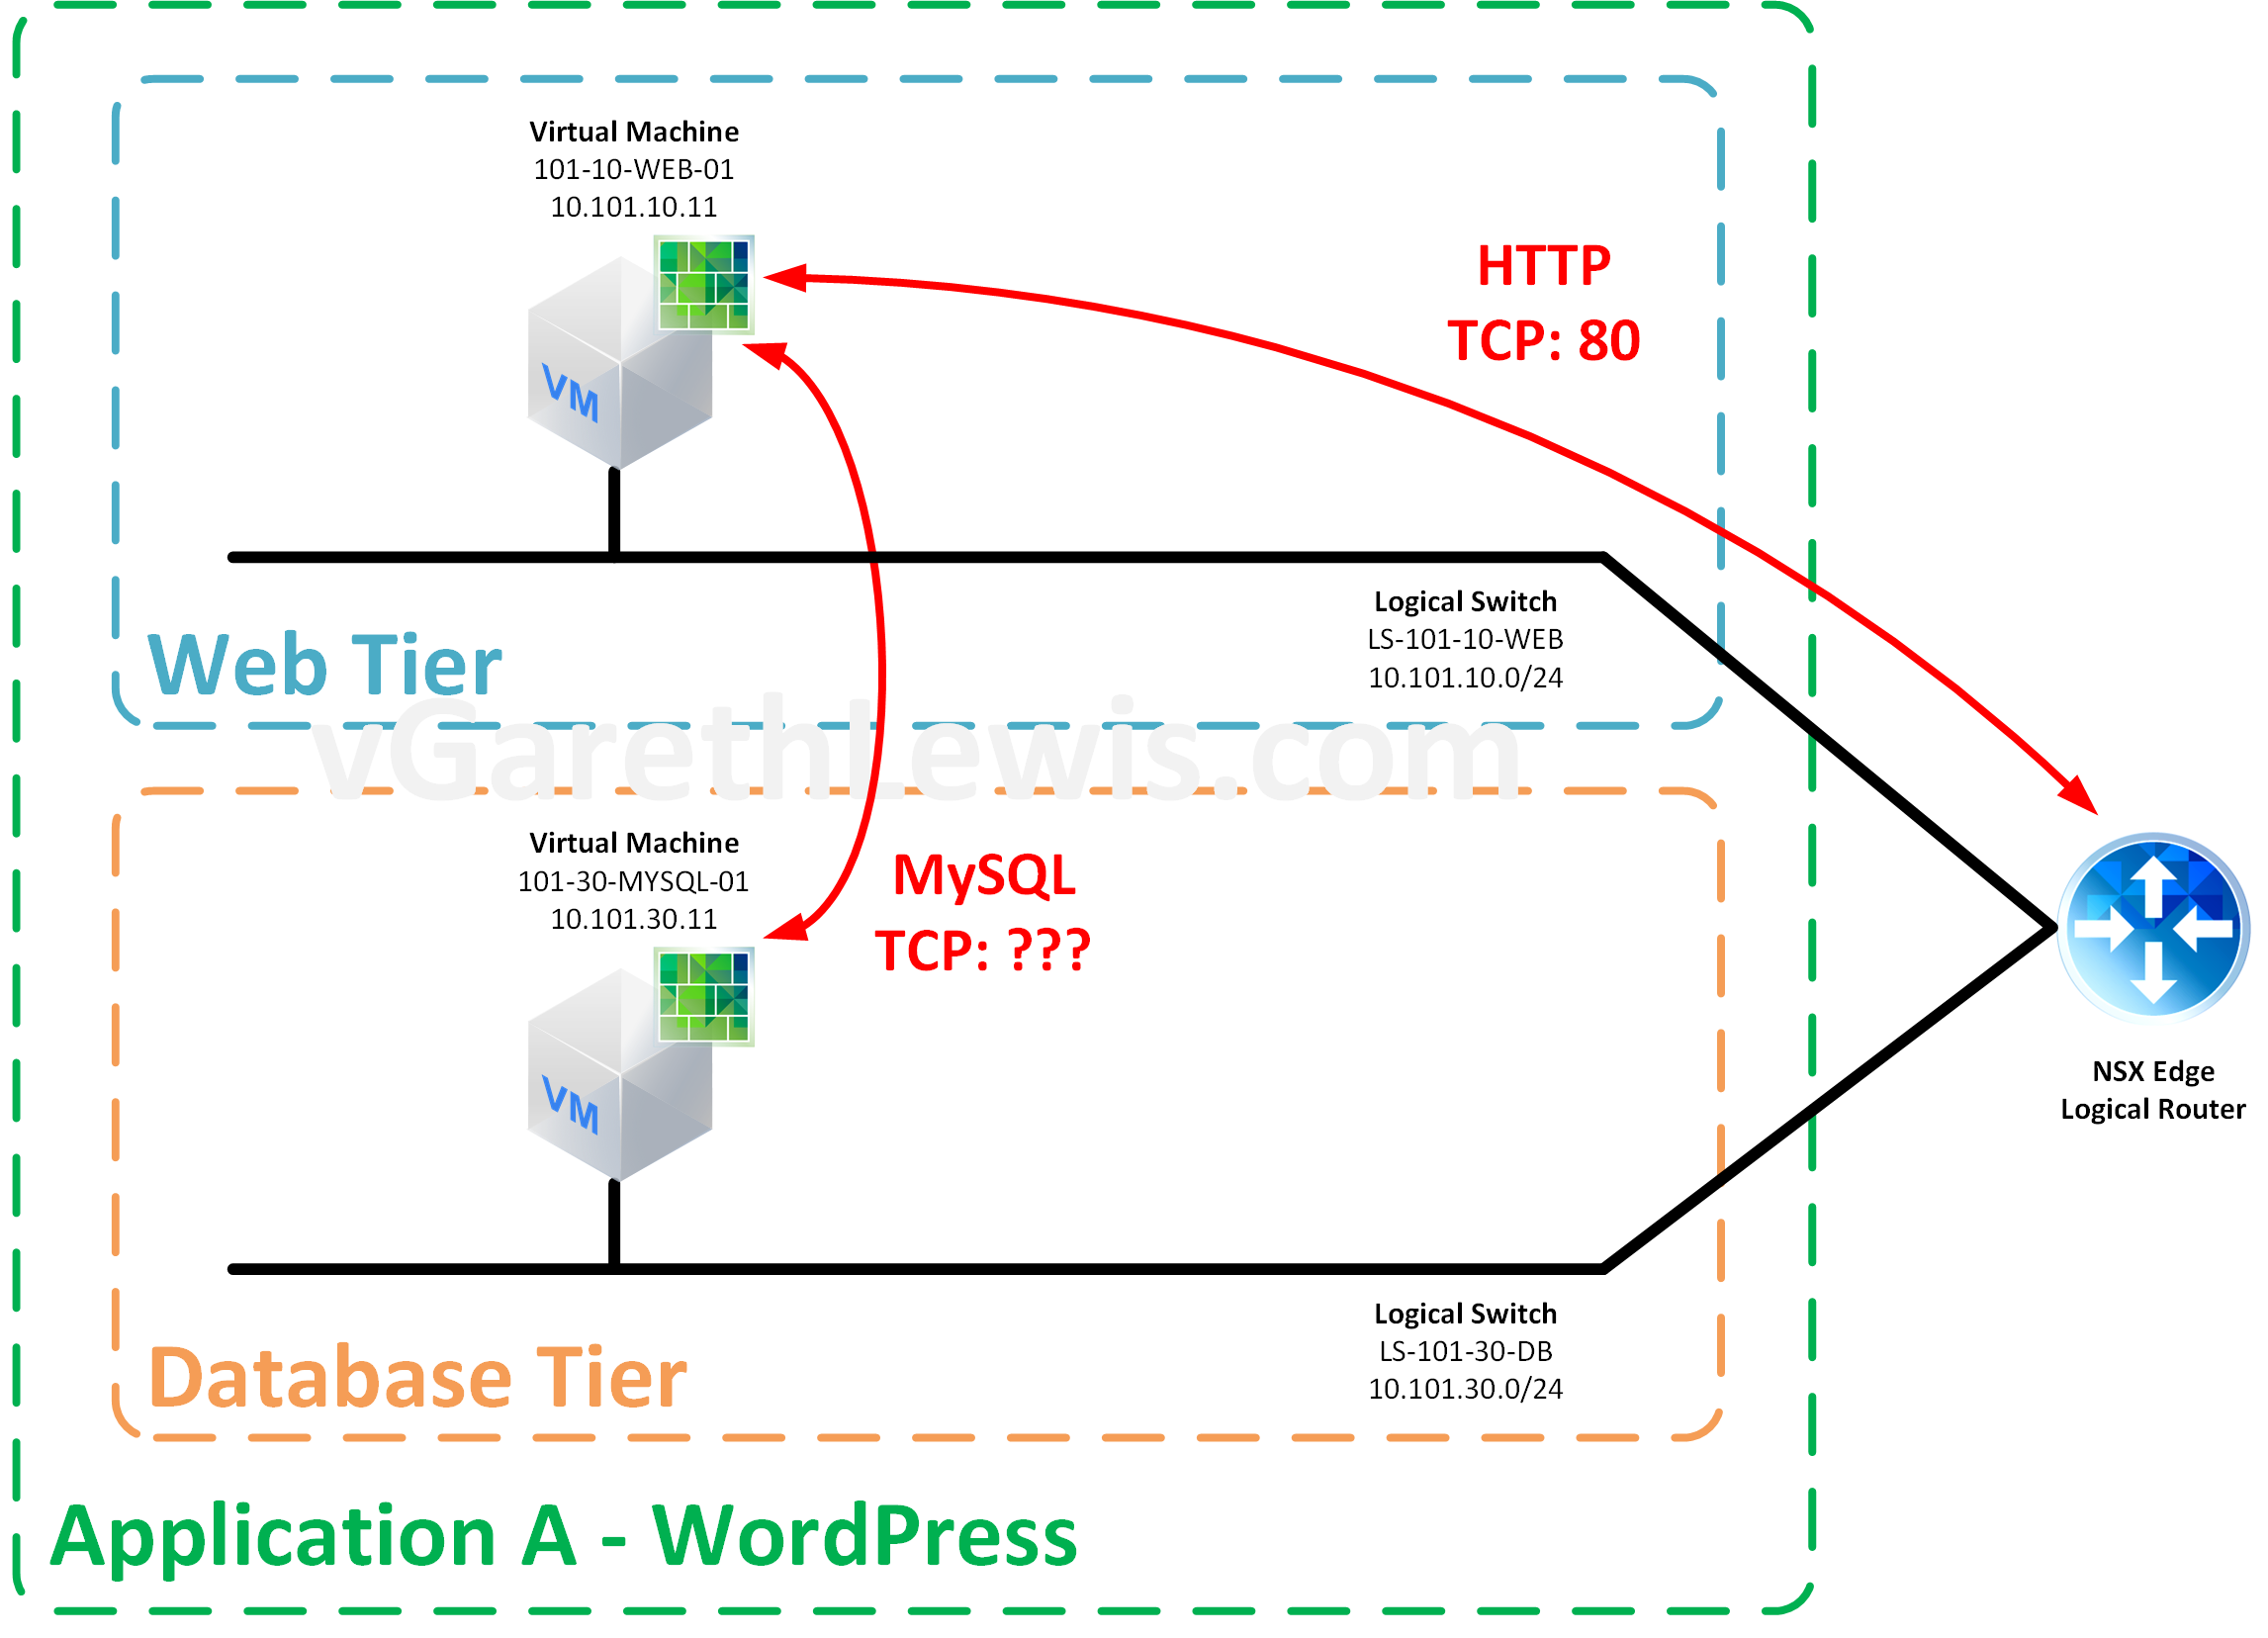
We have been requested to micro-segment a simple WordPress solution. This consists of two VMs:
- Web Server (101-10-WEB-01) – Runs Apache and hosts the WordPress application.
- Database server (101-30-MYSQL-01) – Runs MySQL.
Each VM in the solution has been migrated from traditional VLAN to VXLAN and, as such, is now housed on it’s own dedicated network segment via NSX Logical Switch.
What We Know…
We know frontend access to the solution is successful via HTTP 80.
What We Don’t Know…
We have no information detailing the MySQL configuration. Let’s say, in our scenario’s example, the team who implemented the solution has since left the organisation. Documentation for the solution does not exist. So, in our scenario, we have no idea what port MySQL has been configured to utilise.
We have enough information to lock-down access to the frontend web server, so we can implement a Distributed Firewall rule to this effect.
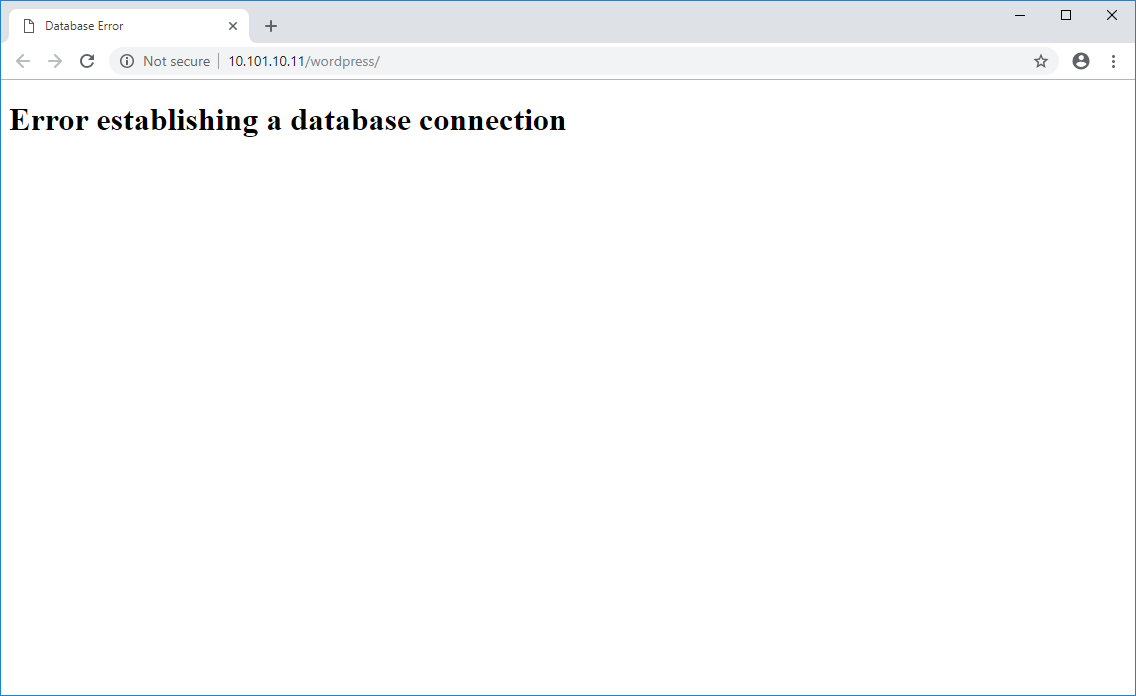
Our Issue…
MySQL access is our issue as, as you can see from the below screenshot, the frontend web server is unable to communicate with the MySQL server, resulting in a downed application. To combat this, let’s create a new Application Rule Manager capture session to visualise what’s going on within (and around) the application.
Please note, this environment utilises VMware vSphere 6.7 Update 1 and VMware NSX Data Centre 6.4.3.
Create a Monitoring Session
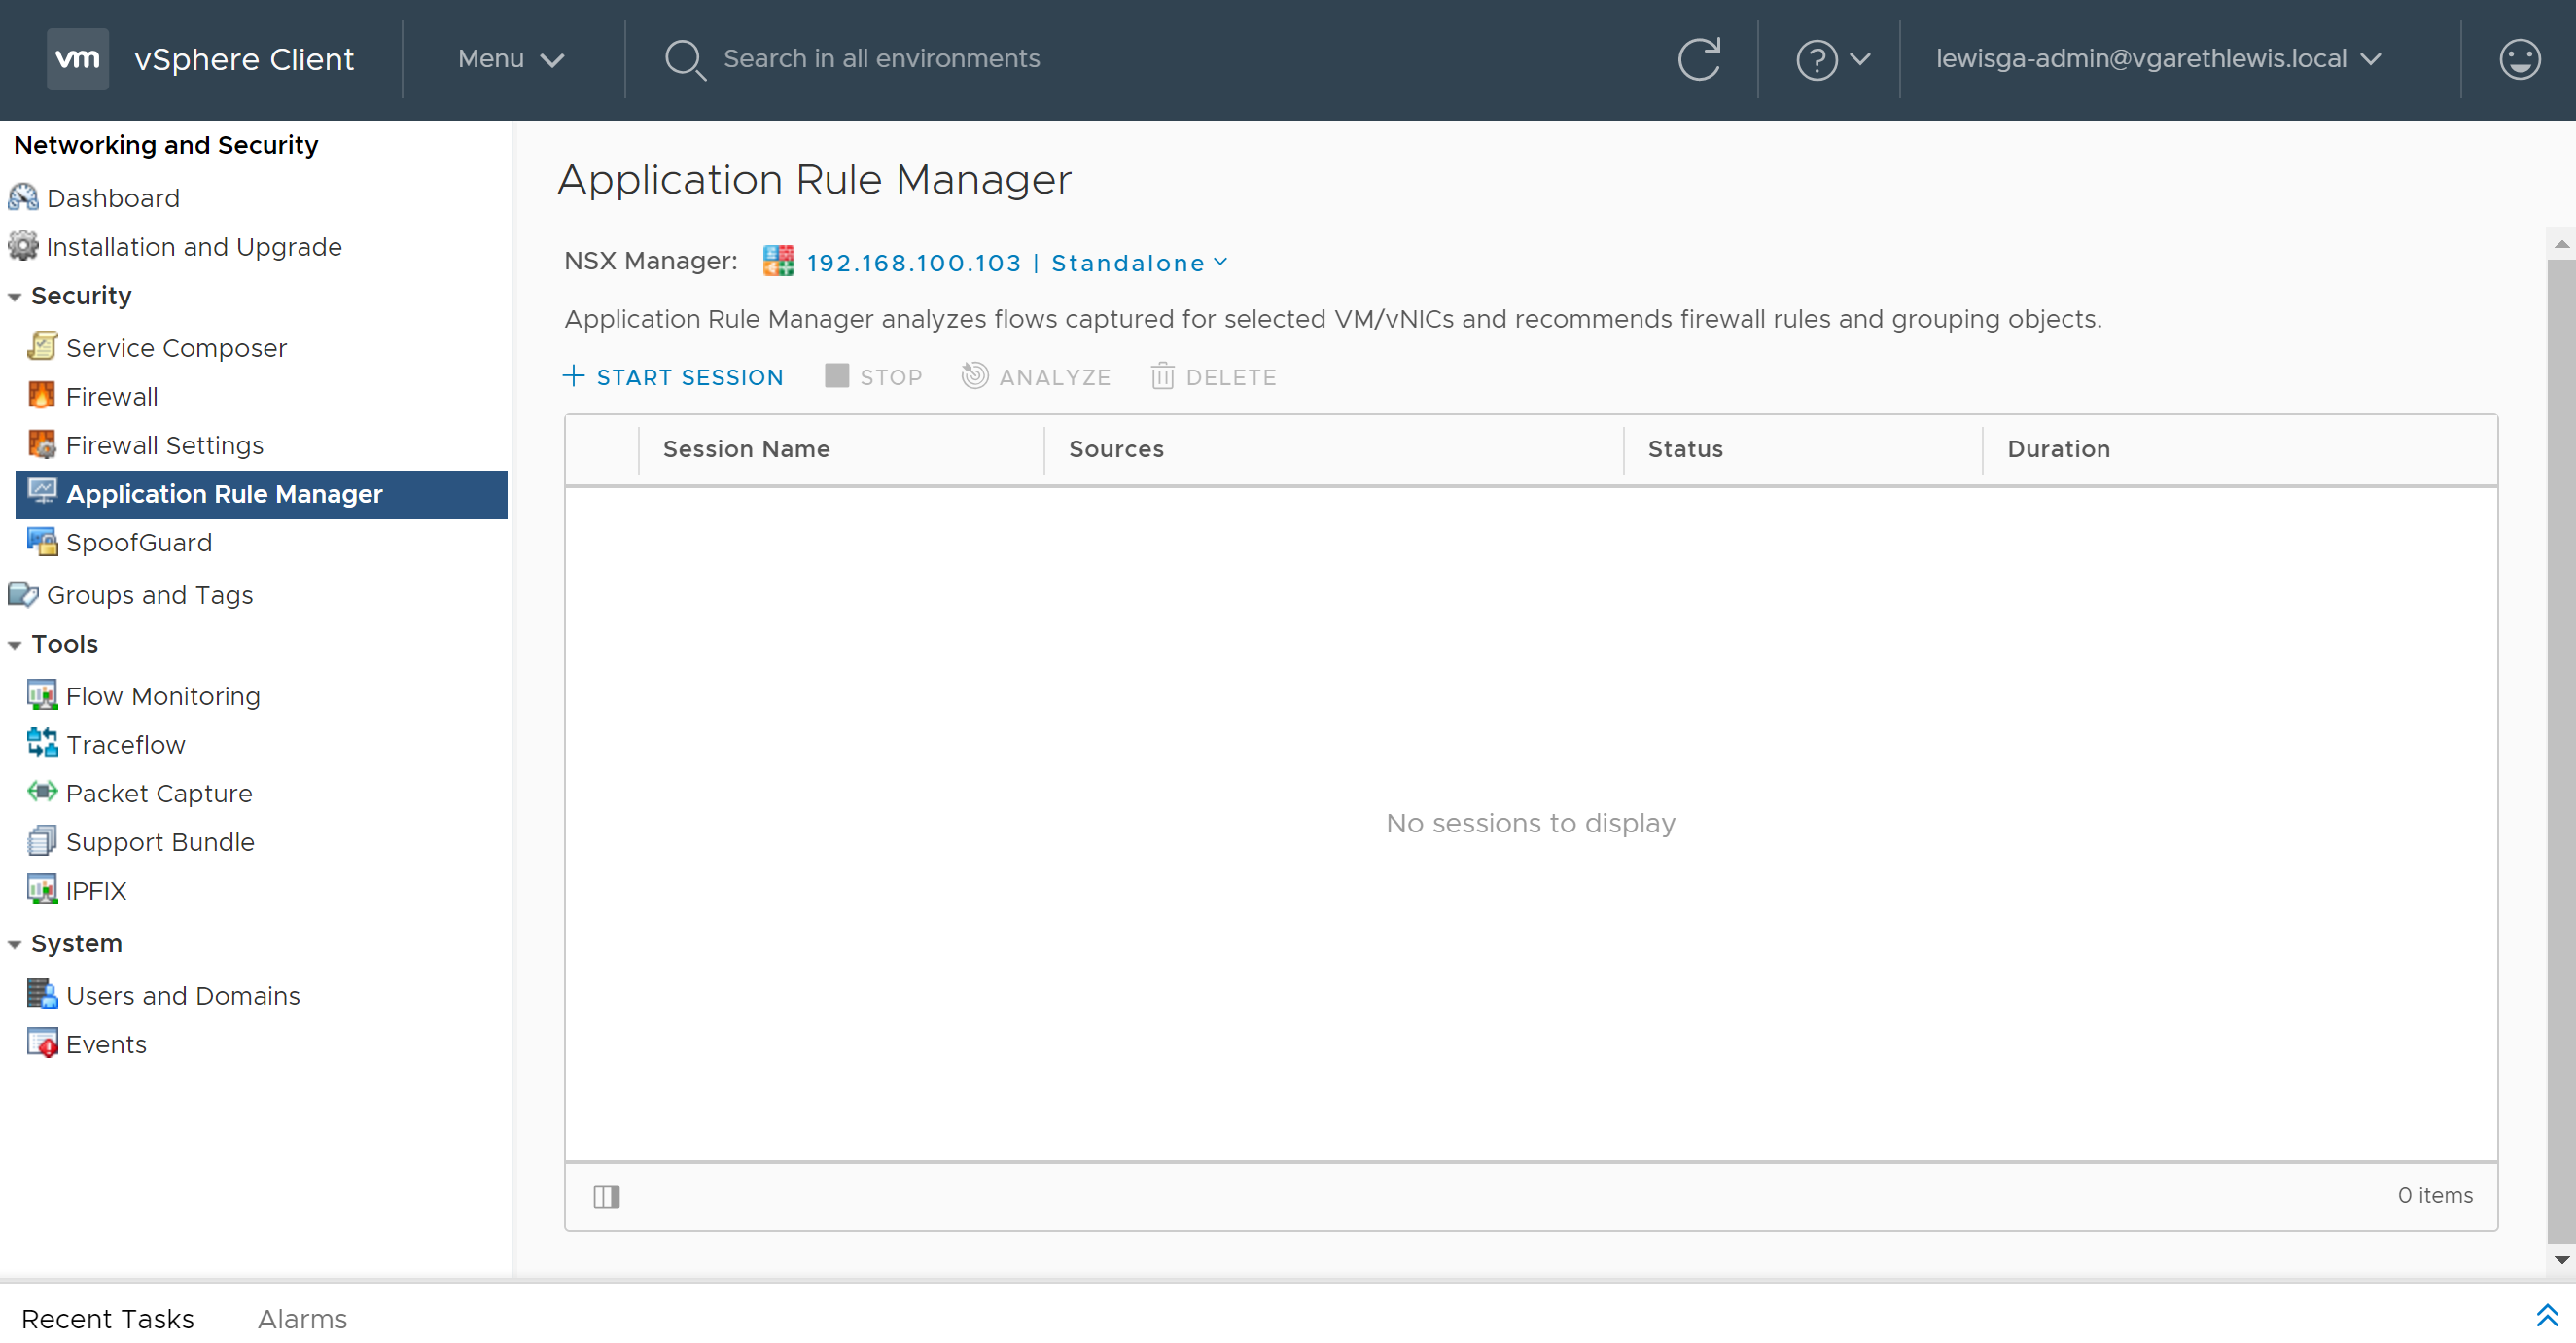
1. Browse to Networking and Security > Security > Application Rule Manager and click + Start Session.
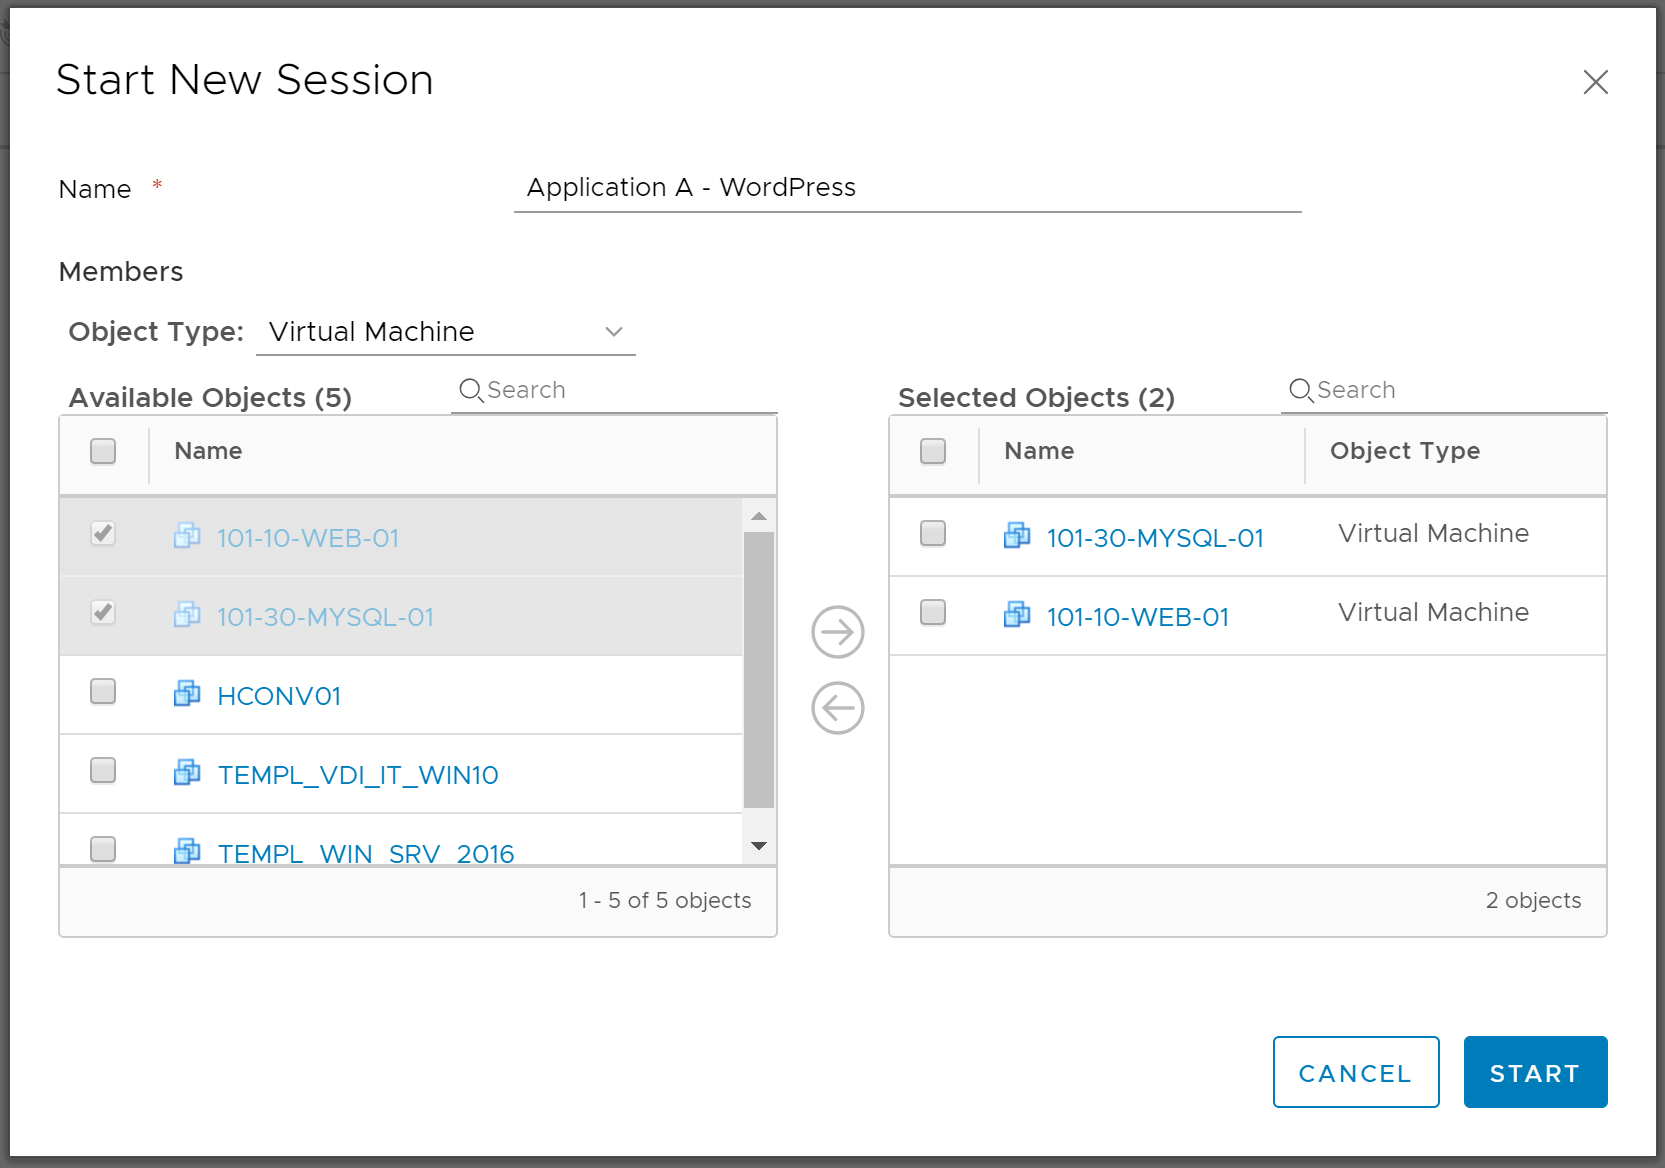
2. Give your session a Name and select the required Objects (in our case VMs 101-10-WEB-01 and 101-30-MYSQL-01). When ready click Start.
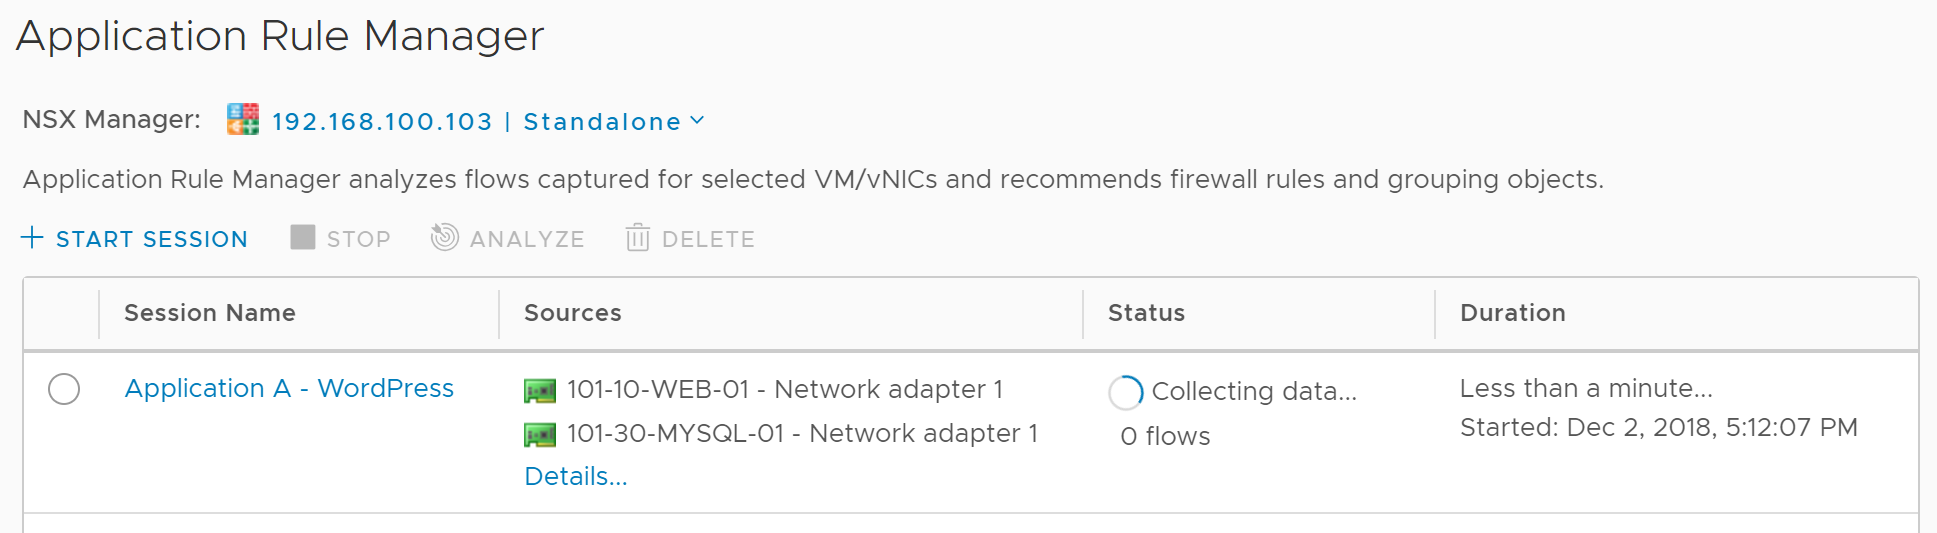
3. Allow the session to begin its data collection.
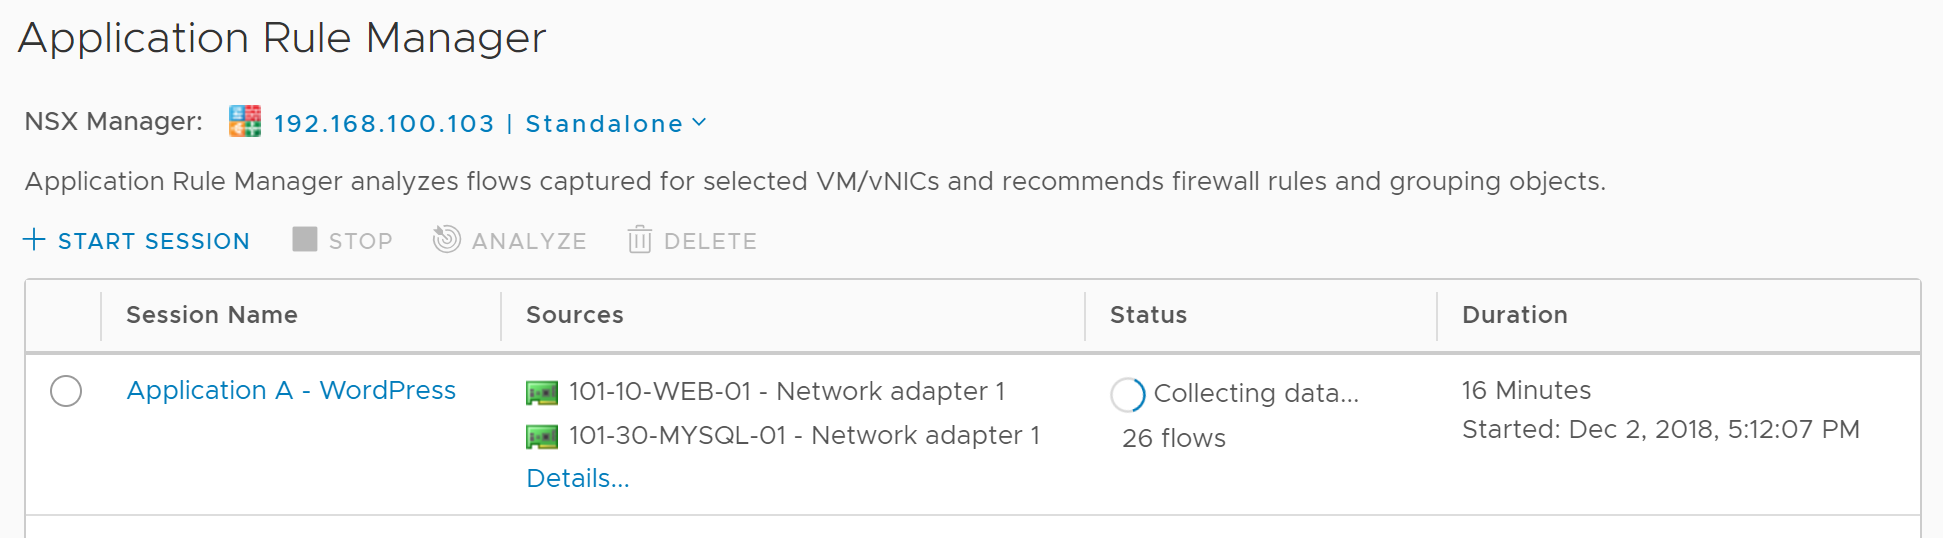
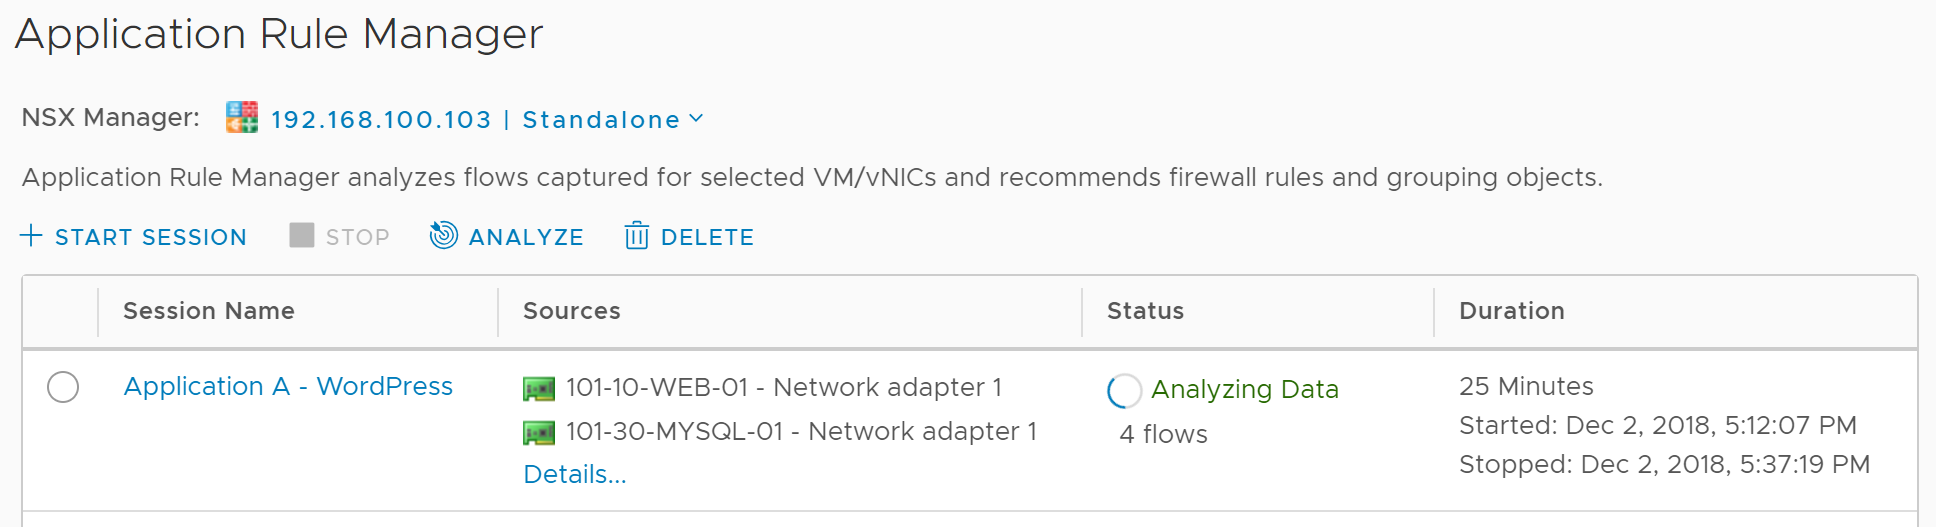
4. After a while (you’ll notice my session has been running for 16 minutes), a number of flows will have been identified. To see the flows live, simply click the name of your session.
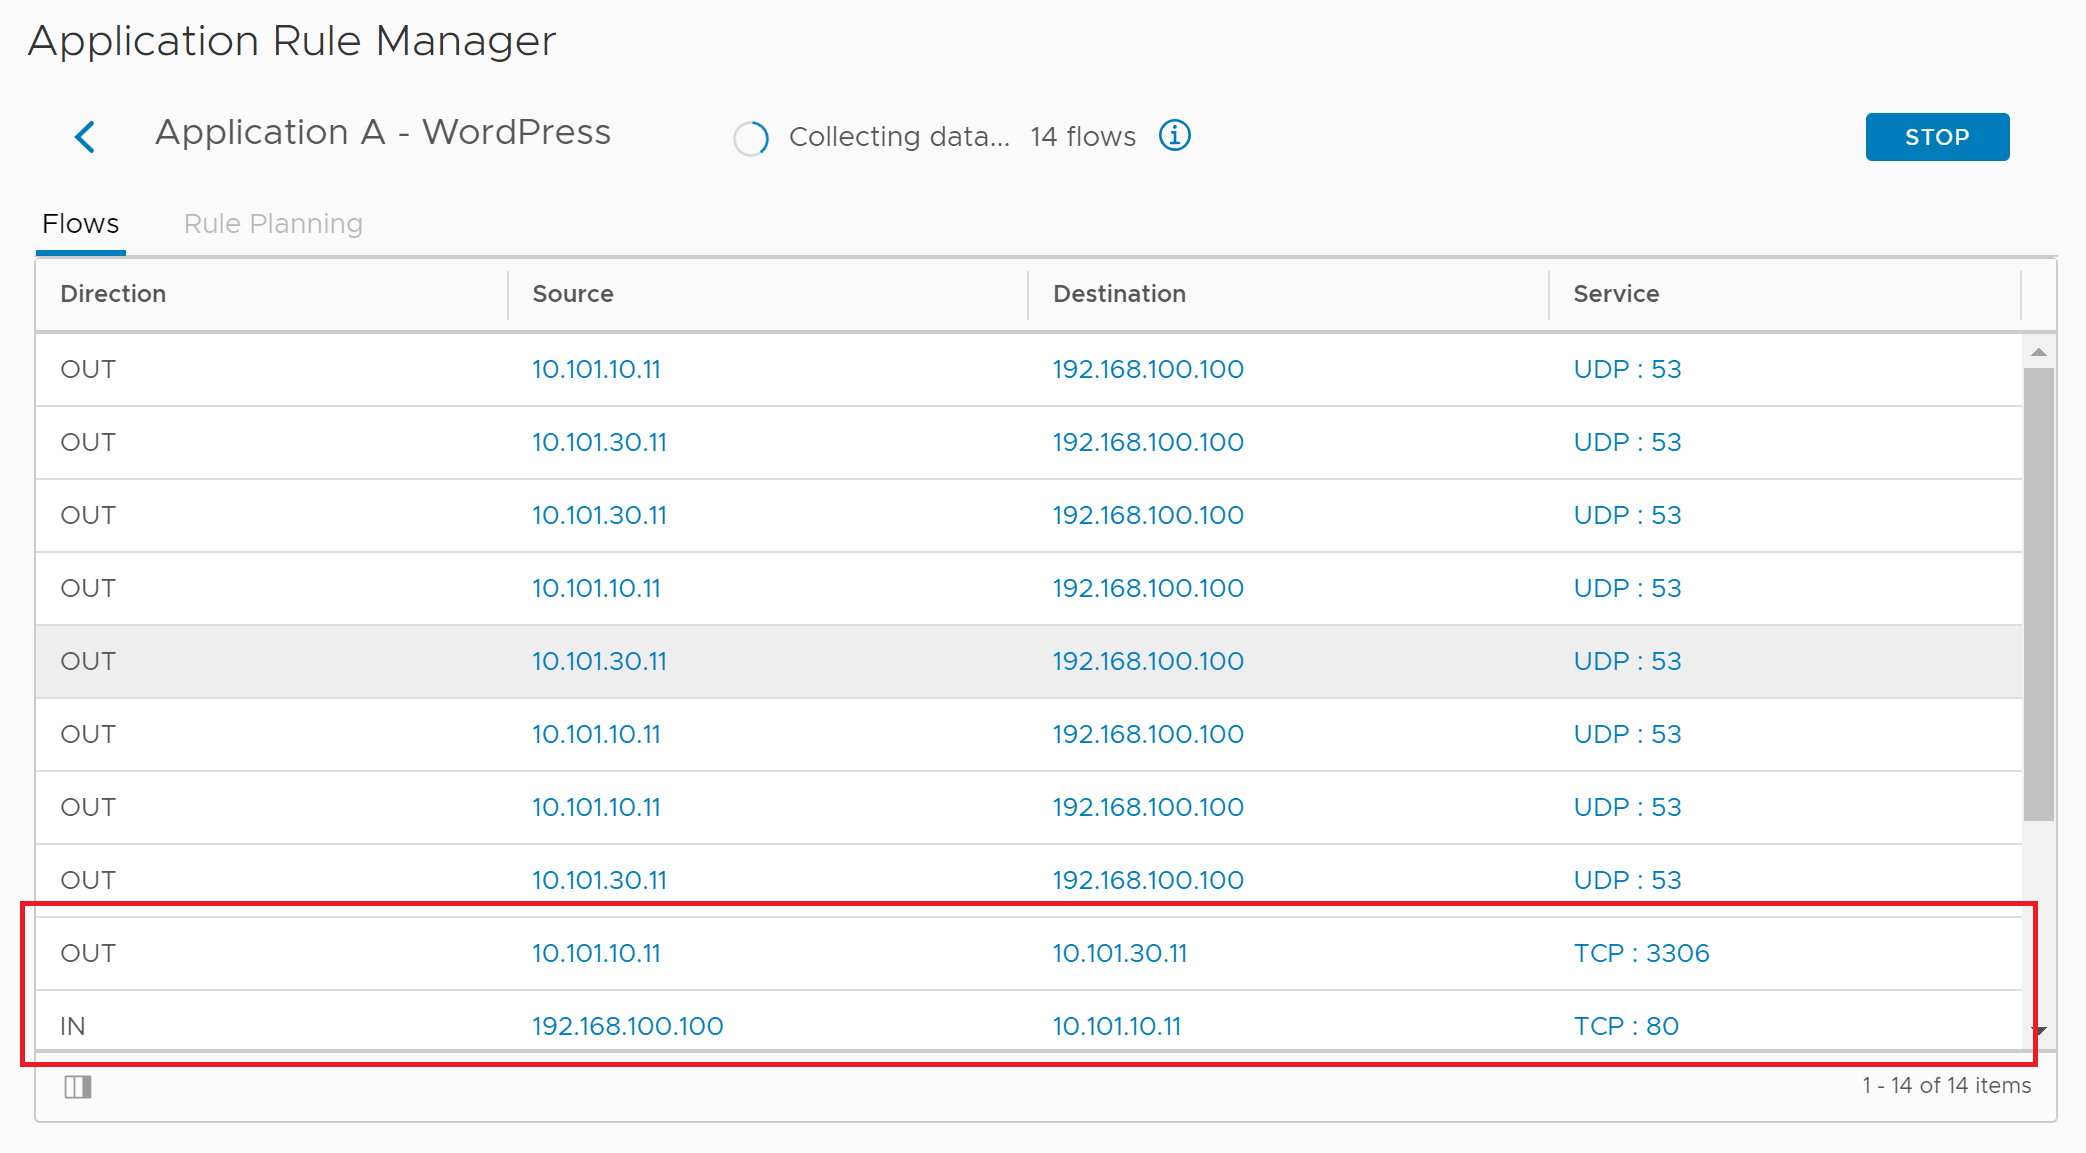
5. You will now be presented with the live flow table.
Note, TCP ports 80 and 3306 (HTTP and MySQL respectively) have been identified (looks like MySQL had been configured with the default port). When you believe you have captured the appropriate information, click Stop.
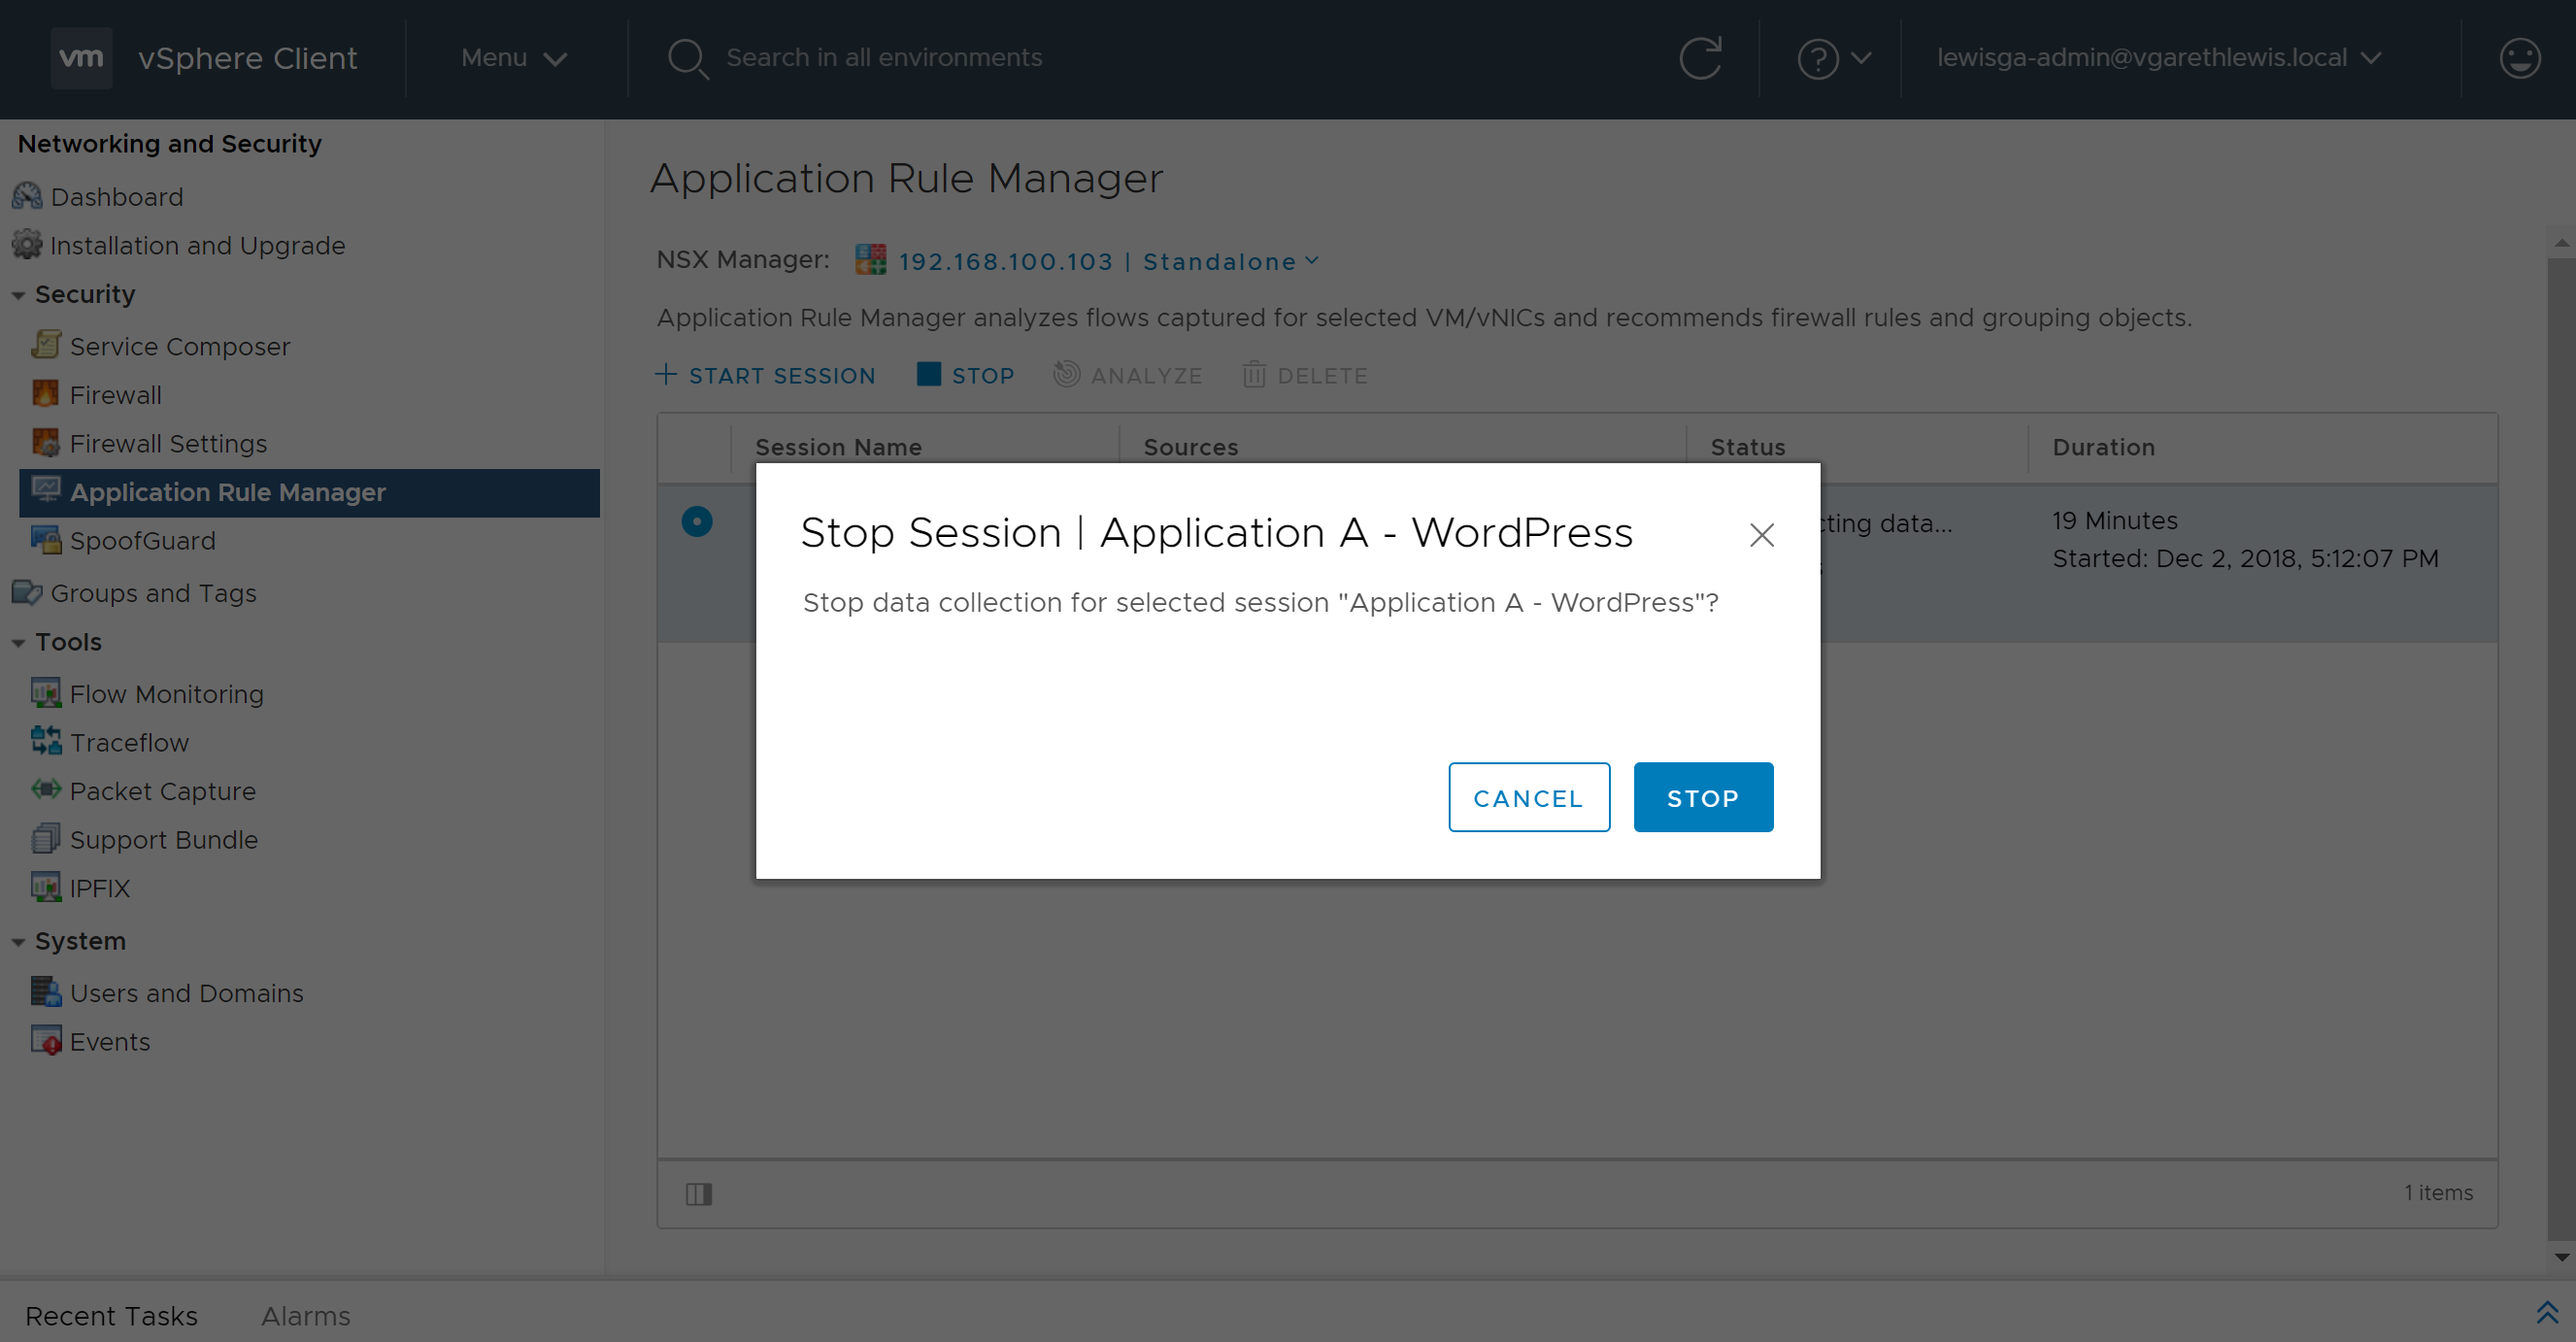
6. Confirm the session termination by clicking Stop.
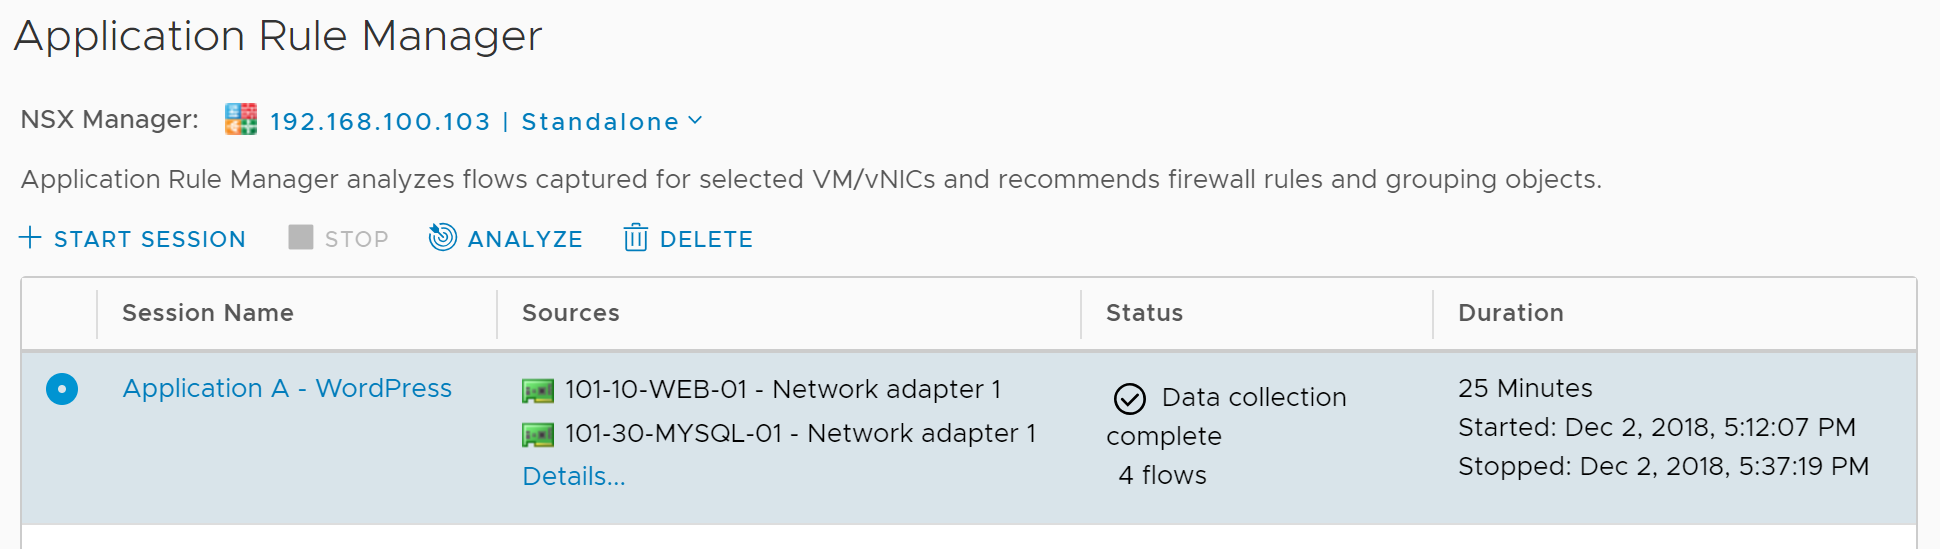
Now we have collected the session data, let’s look at the analysis.
Analyse Flows
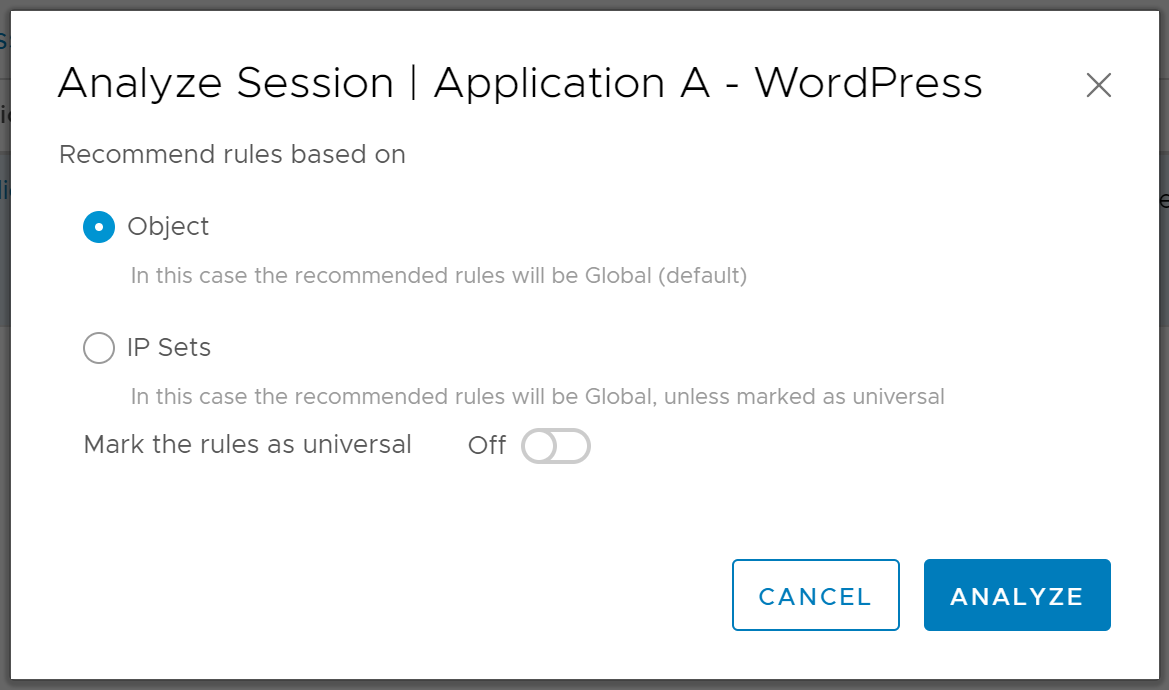
1. To begin analysing the flows, click Analyze.
2. When prompted, choose which option you’d like to base your rule recommendations on (in this instance I will choose Object). When ready, click Analyze.
3. The data analysis stage will now begin…
4. …and after a short while, will complete.
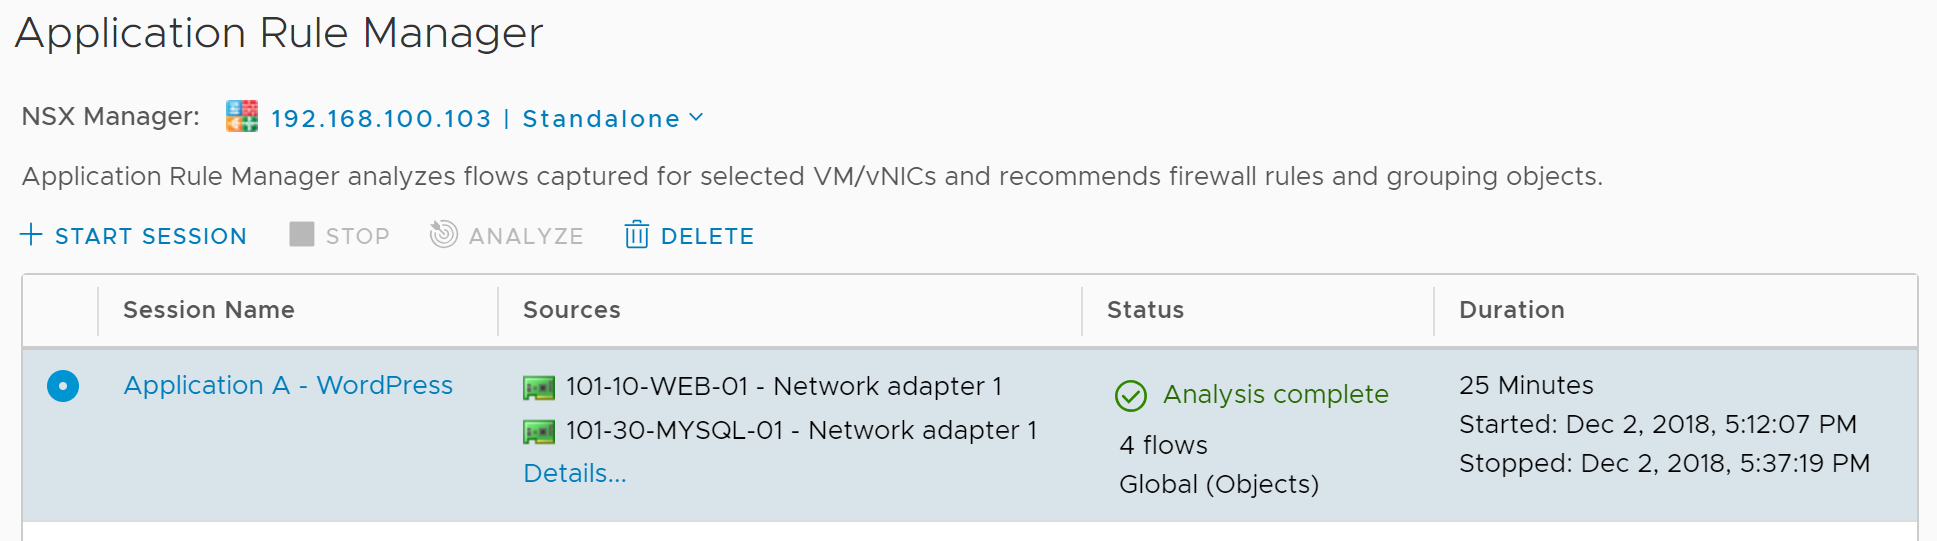
With the flow analysis complete, we are now ready to begin interrogating the results in readiness for the Distributed Firewall rules.
Reviewing the Analysed Flows
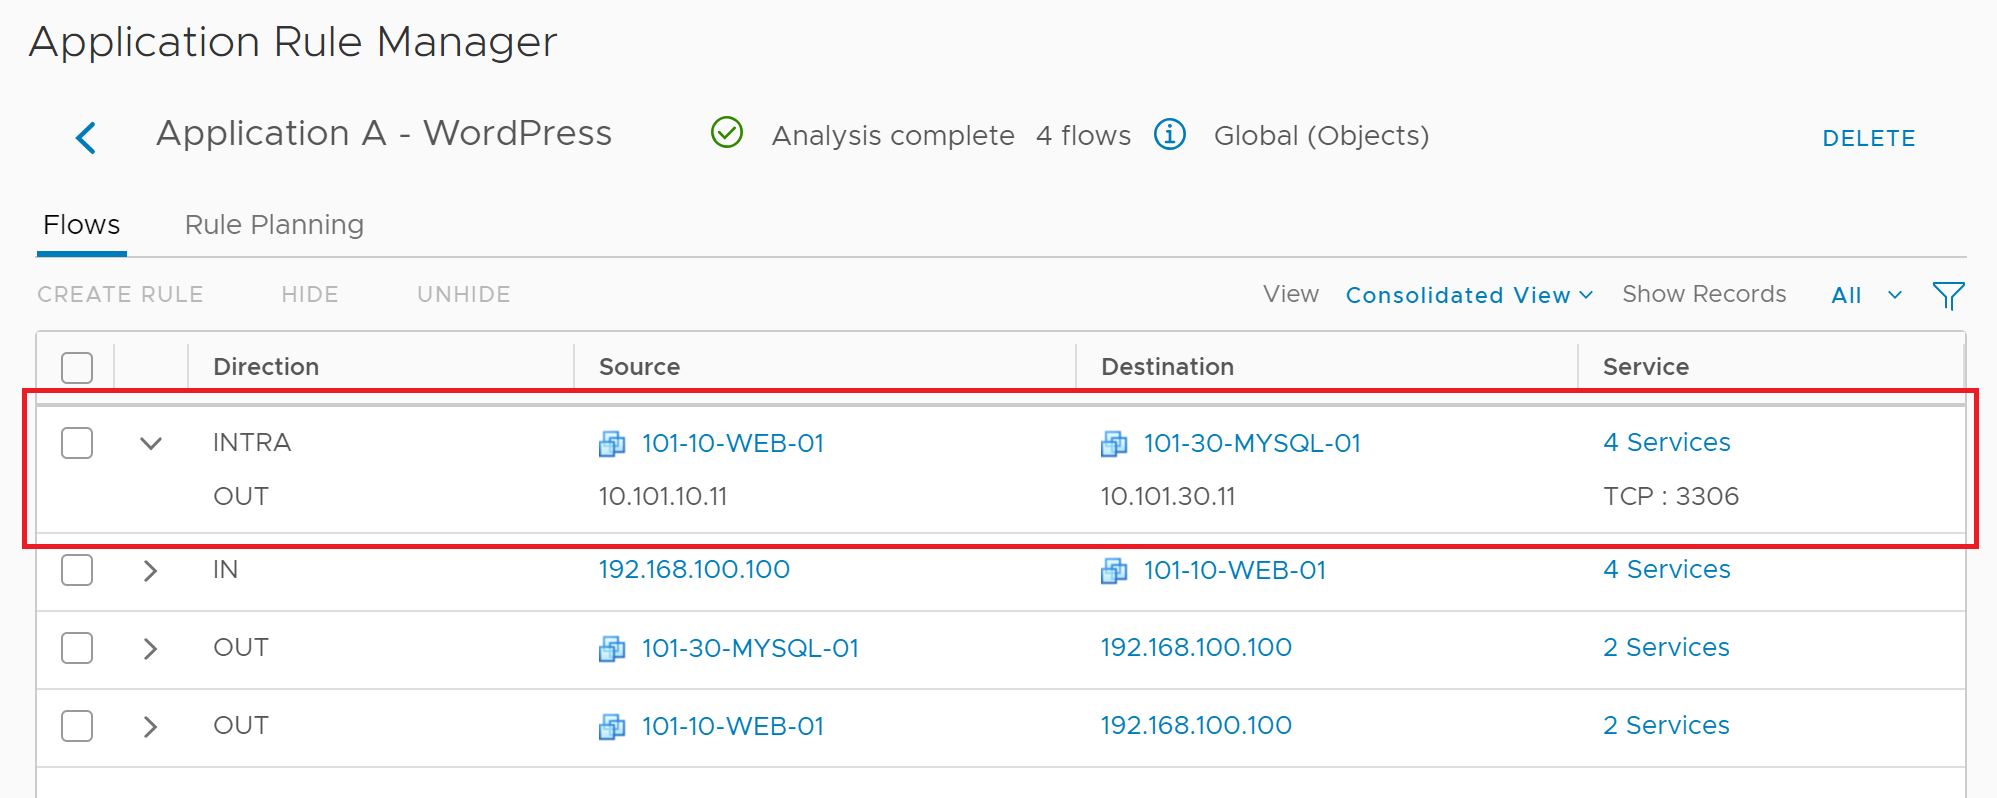
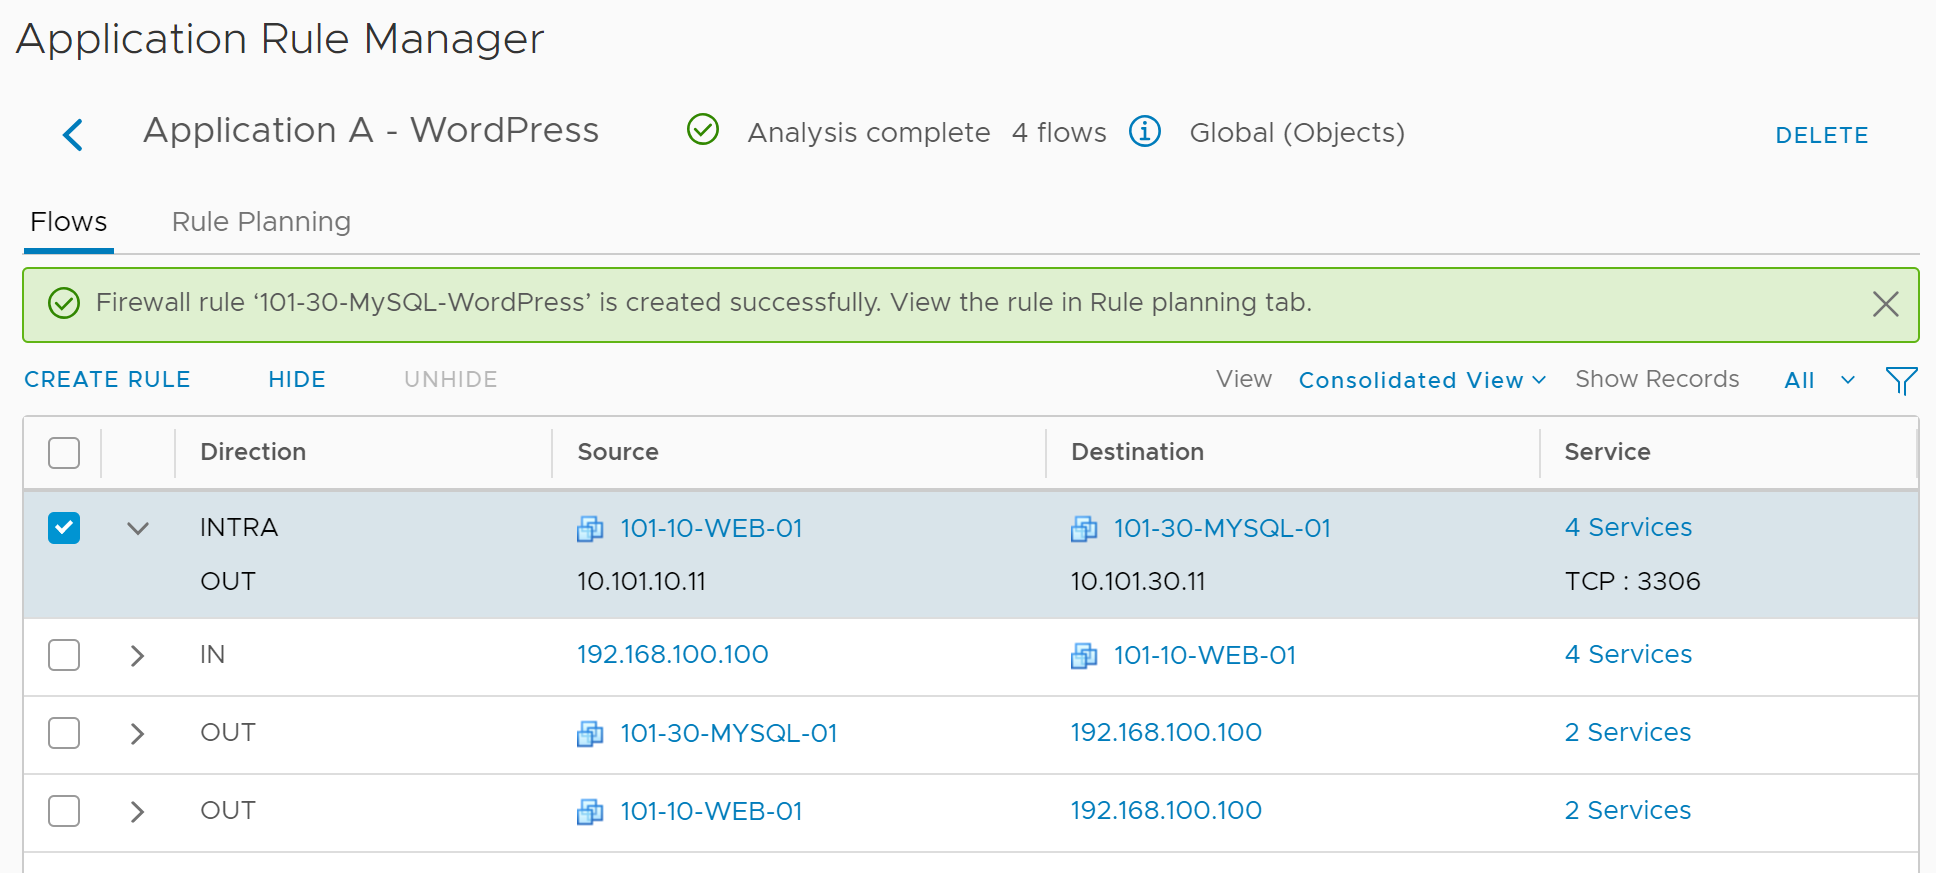
Let’s take a look at the flow analysis (see below screenshot). Straight away, the traffic between web and database servers is clearly visible. So we’re ready to begin the firewall rule creation process.
Note, analysis of a real world, multi-tiered application isn’t always as straight forward. I have analysed numerous applications (again, without any documentation) which have had so many unknown dependencies, it’s hurt my brain. The key? A long data collection process, followed by an analysis, and numerous cups of tea while an attempt is made to decipher said dependencies. There’s no trick here, simply data collection, analysis, and discussions with your vendors and/or software development teams. Communication is key.
Once your flows have been identified, select it/them and click Create Rule.
Post-Analysis Firewall Rule Creation
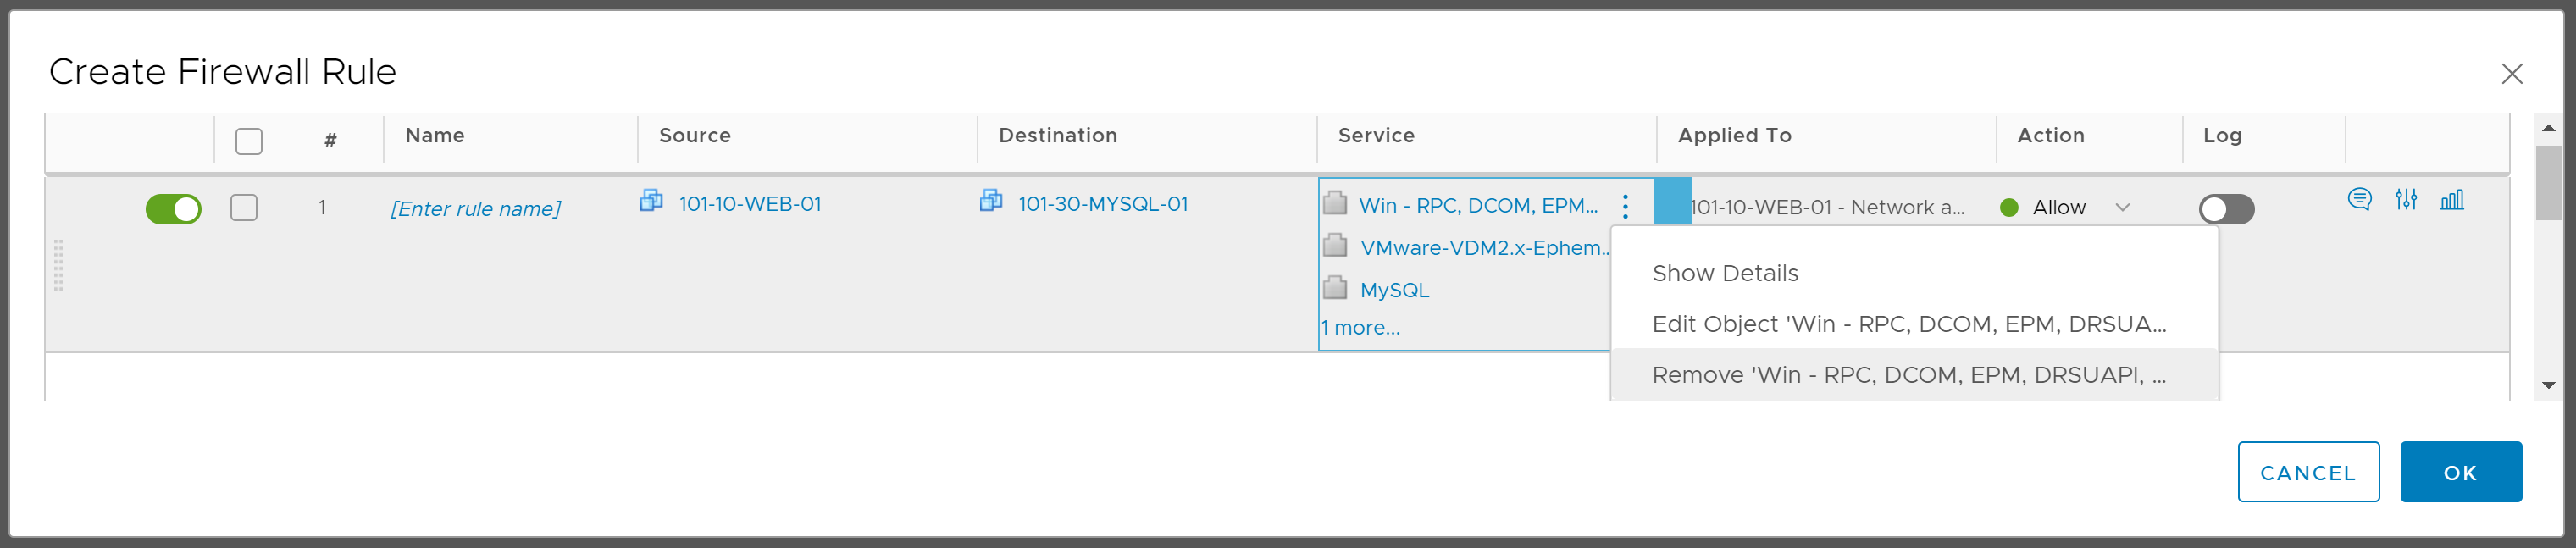
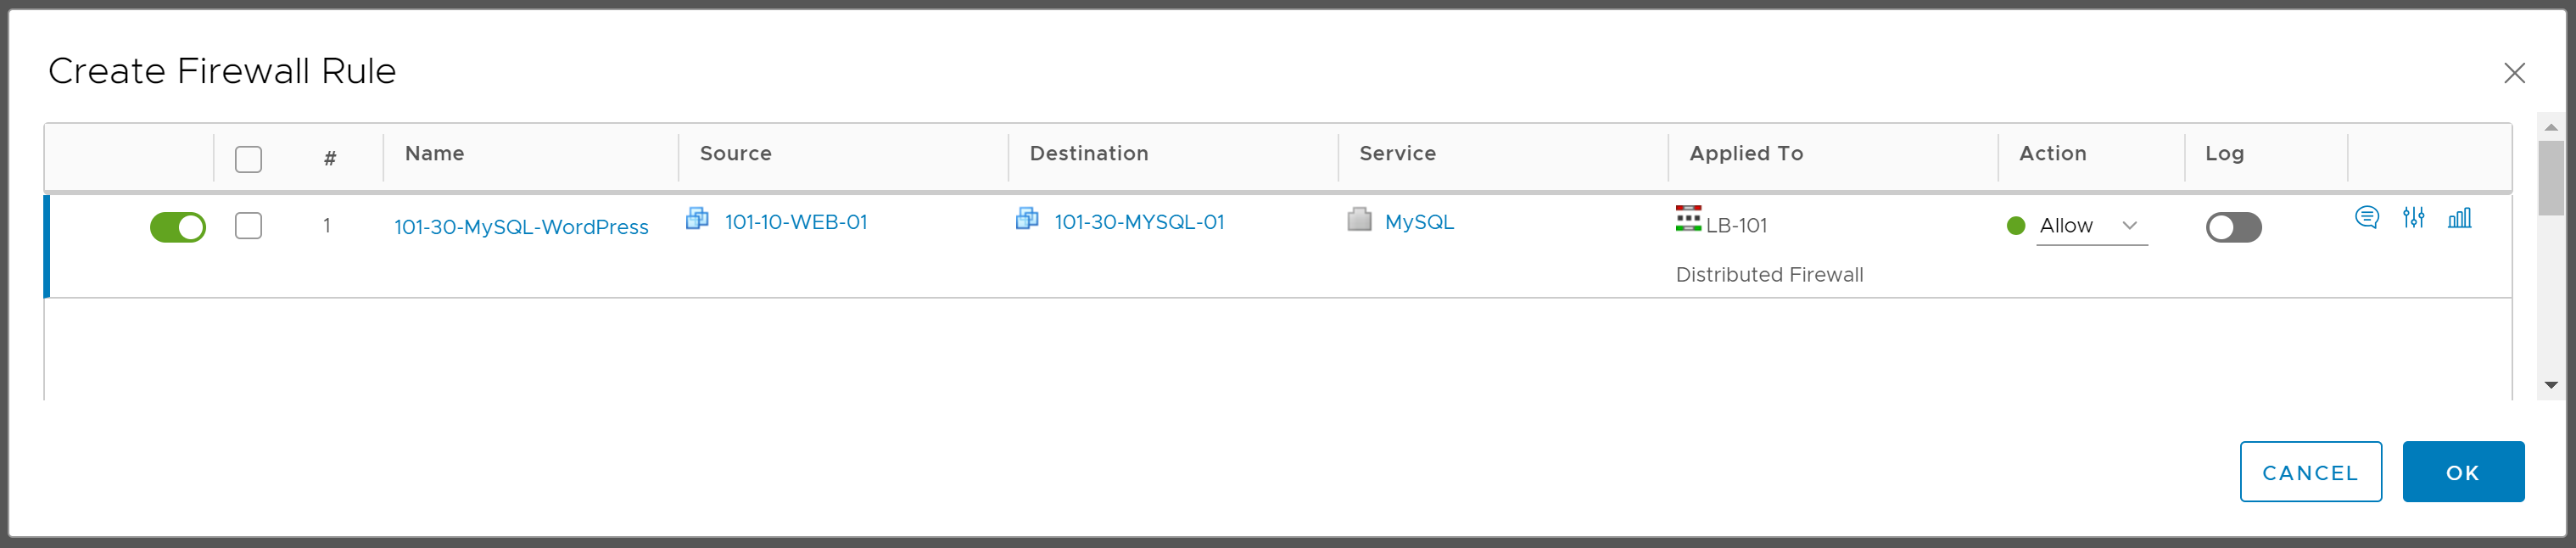
1. With our rule now starting to take shape, we simply need to ‘tune’ it a little before we are ready to publish.
Note, from the below screenshot you’ll note more than just the ‘MySQL’ service is listed in the Service column. In this column you’ll find all Services and Service Groups predefined within NSX which include TCP port 3306. You can opt to include them all, however, I would advise you to ONLY include the specific service you require. For example, the Service ‘Win – RPC, DCOM, EPM…’ shown below includes a dynamic port range of 1025-65535. For security reasons, this is a range you would not want to include in an ‘allow’ firewall rule unnecessarily.
2. Once you have assigned an appropriate Name, and have sanity-checked the included Service(s), and confirmed the rule application, click OK.
Note, in the below screenshot, I have chosen to apply the rule to both Distributed Firewall and upstream NSX Edge Distributed Logical Router; as the two VMs are housed on two separate networks they require routing (via NSX Distributed Logical Router, LB-101).
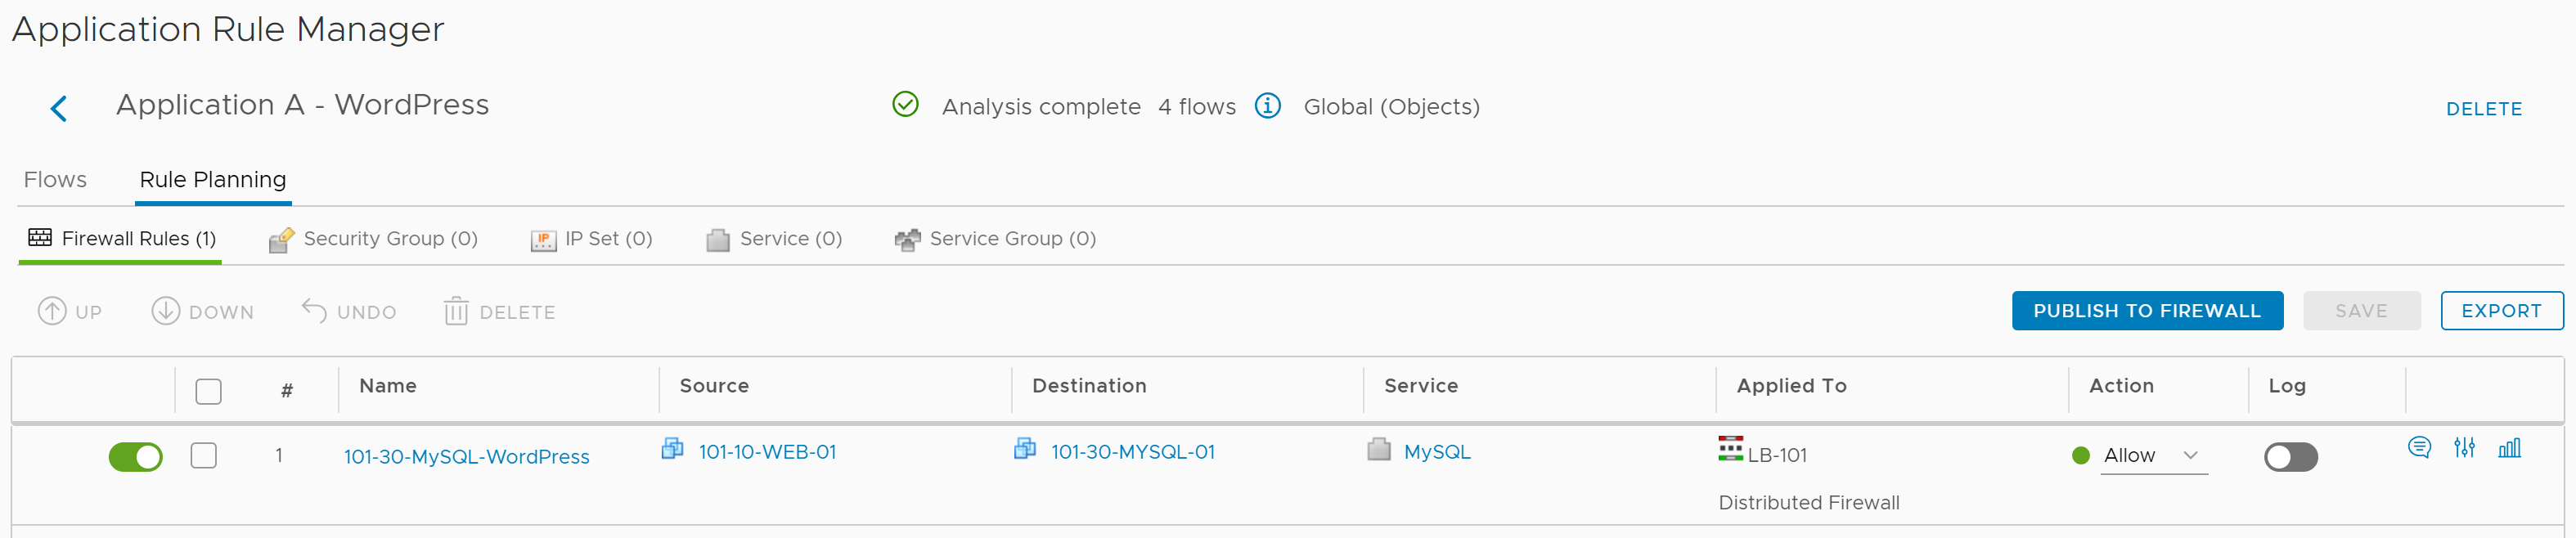
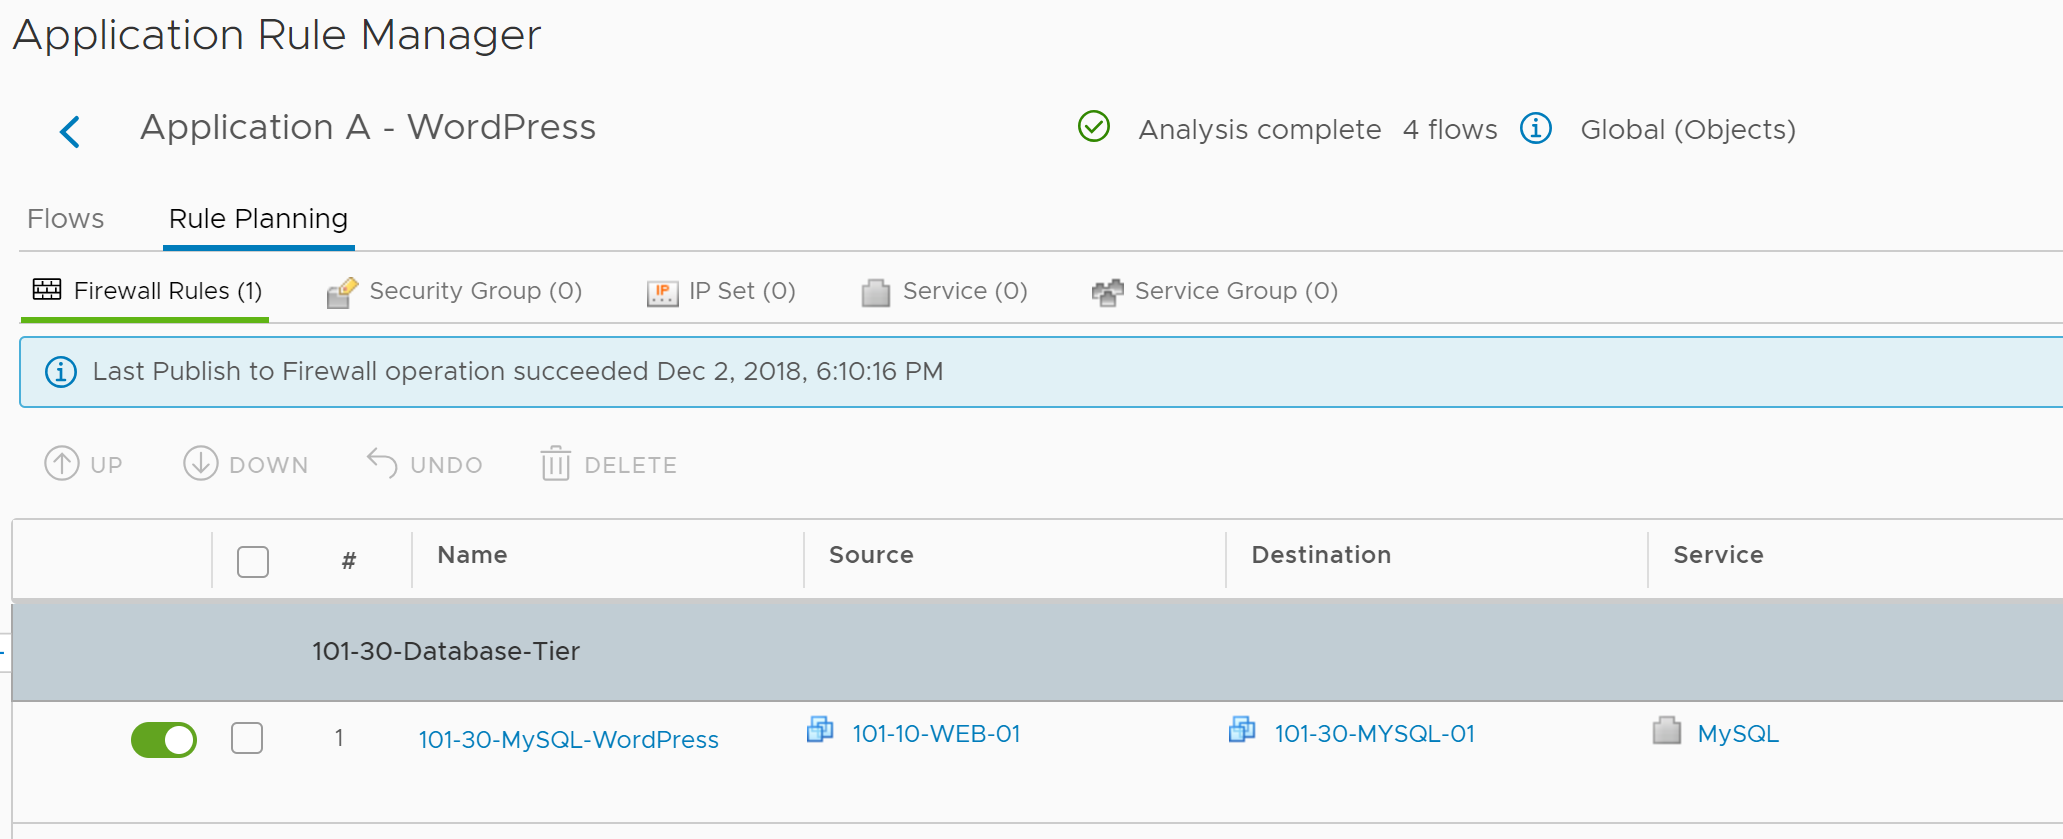
3. Confirm successful creation of the rule template as per below.
4. Browse to Rule Planning and, when ready, click Publish to Firewall.
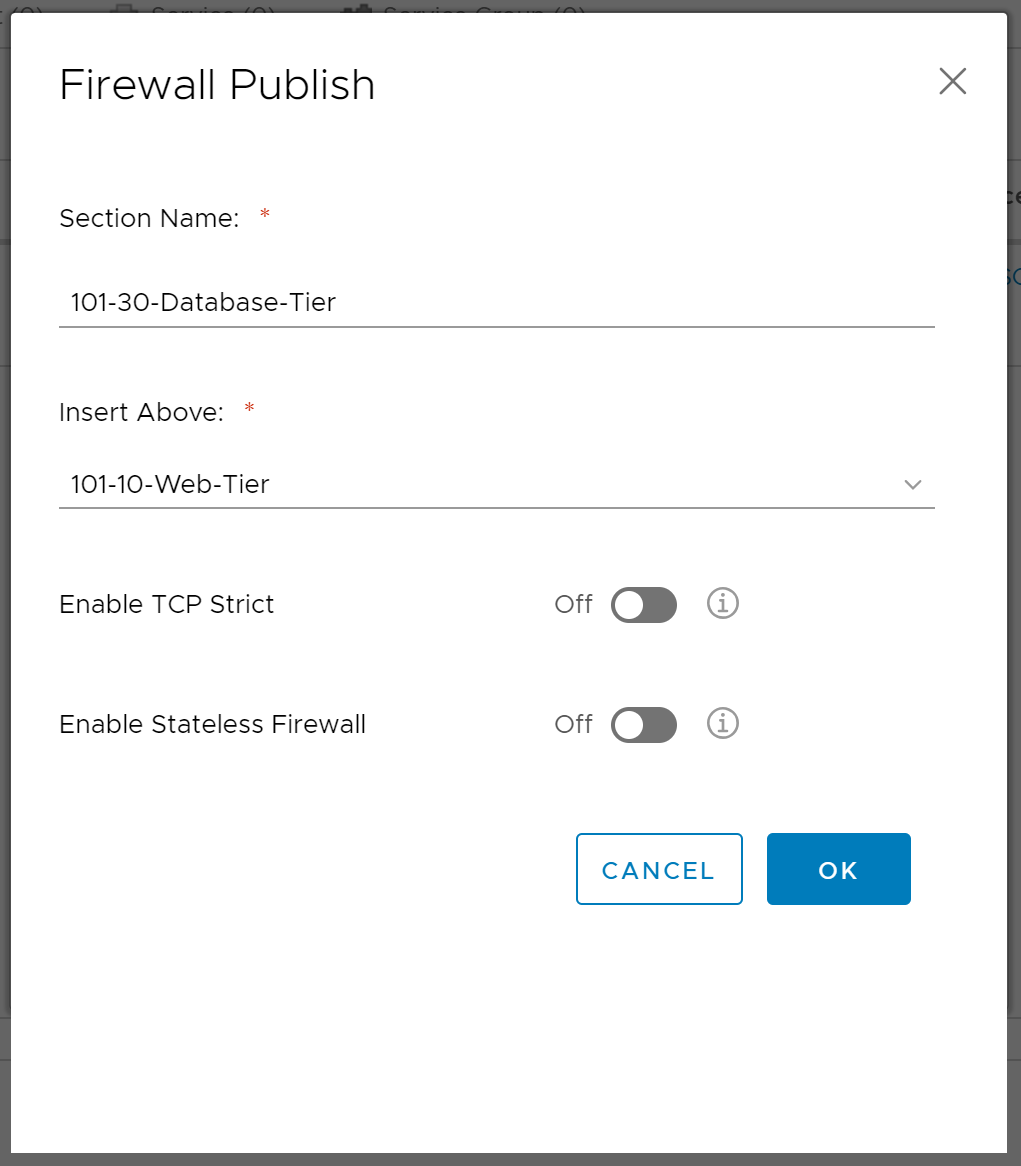
5. Finally, give your new rule a Section Name, and choose where to insert said Section. When ready, click OK.
6. Confirm successful publication of the rule template as per below.
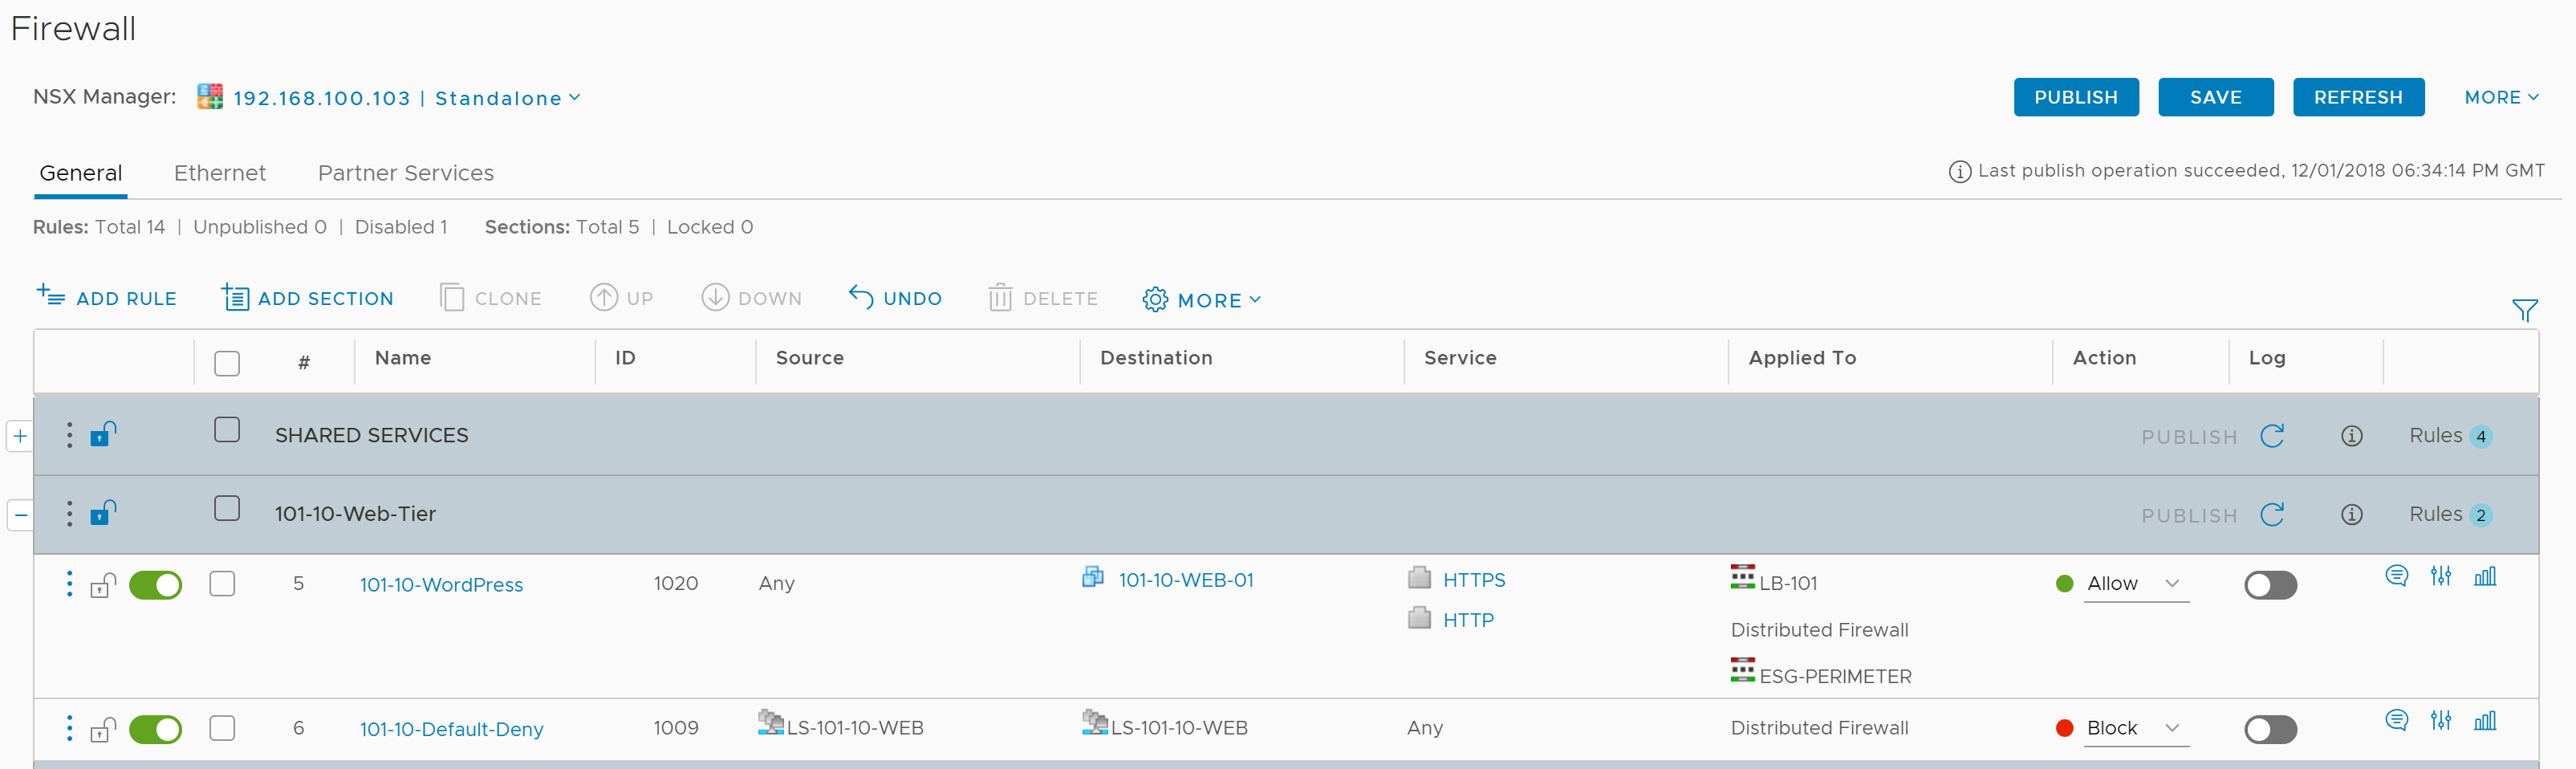
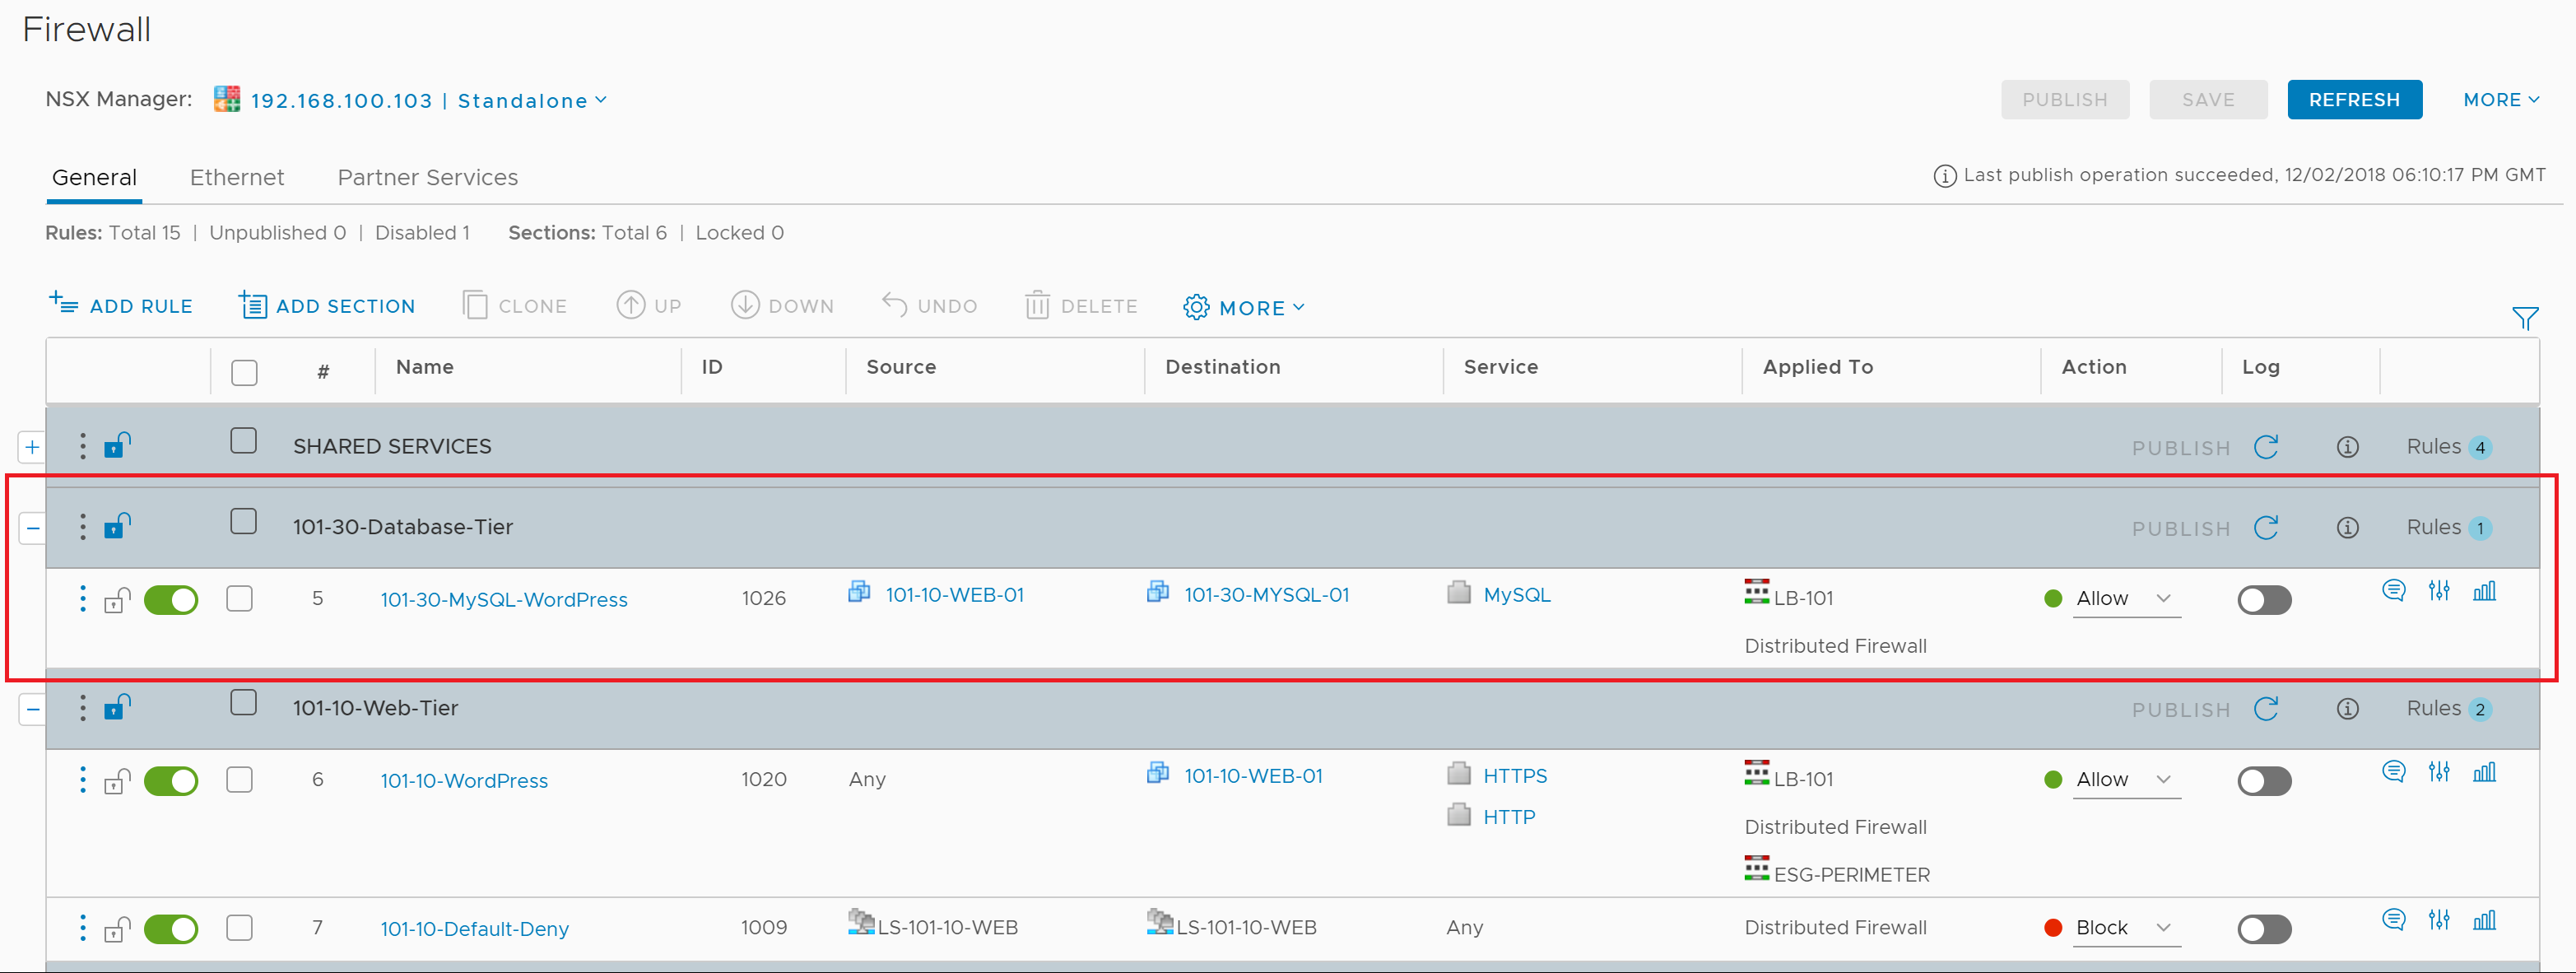
7. Browse to Firewall and confirm successful publication of the new rule.
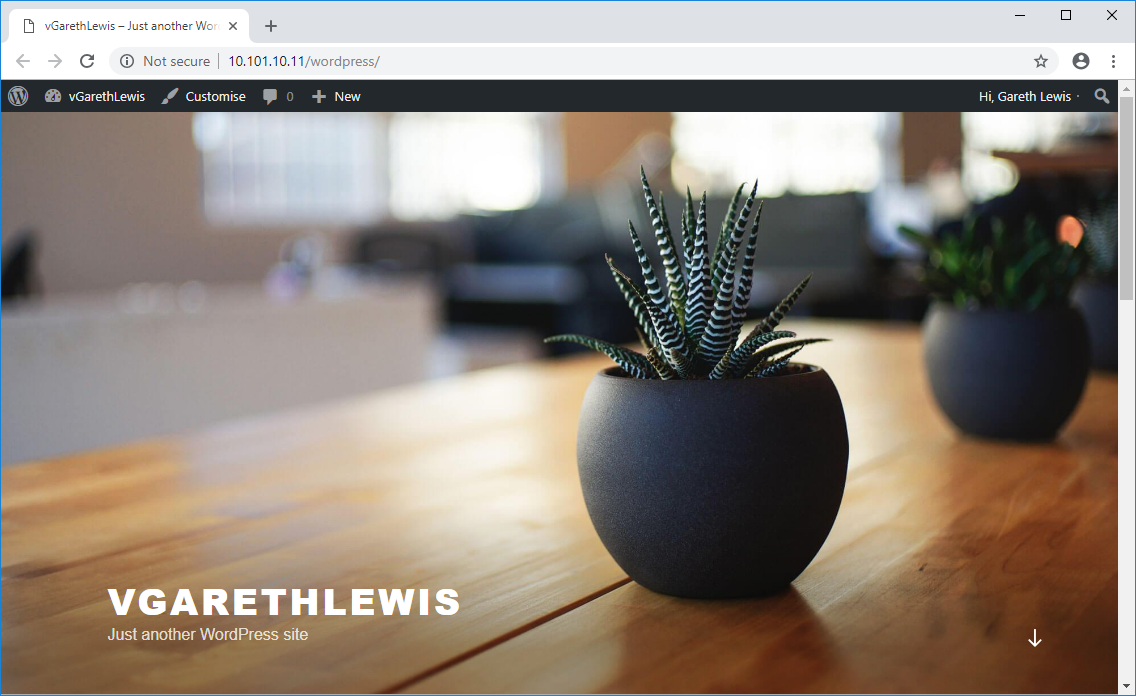
8. Last, but not least, ensure the new rule brings your application back online. In the below screenshot, traffic between our frontend WordPress application and back-end MySQL server is successful.
Conclusion
Okay, in our scenario we had a very basic, two-tier application. The Application Rule Manager was able to identify an unseen port requirement between front and back-end servers quickly and easily, and we were able to publish the required NSX Distributed Firewall rule as a result.
In reality, and as I’ve already mentioned above, this process can sometimes take a little longer. This ALWAYS comes back to a lack of application documentation and/or understanding. Talk to your software guys, map-out the application, and once you have documented all you can, run the Application Rule Manager. If in doubt RUN THE APPLICATION RULE MANAGER (there’s a t-shirt in there somewhere…)
The Application Rule Manager is a saviour for Infrastructure teams, Network teams, and support teams. You know, “it’s not the application, it’s the network…”. Sometimes it is, sometimes it isn’t, but the Application Rule Manager can help in your evidence, troubleshooting, and (if it comes to it) defence.
If the application isn’t working and the Application Rule Manager doesn’t display any traffic flows between the dependencies…well, your serve application.
Leave a Reply